Coca Cola 2005 Annual Report Download - page 46
Download and view the complete annual report
Please find page 46 of the 2005 Coca Cola annual report below. You can navigate through the pages in the report by either clicking on the pages listed below, or by using the keyword search tool below to find specific information within the annual report.-
 1
1 -
2
-
3
-
4
-
5
-
6
-
7
-
8
-
9
-
10
-
11
-
12
-
13
-
14
-
15
-
16
-
17
-
18
-
19
-
20
-
21
-
22
-
23
-
24
-
25
-
26
-
27
-
28
-
29
-
30
-
31
-
32
-
33
-
34
-
35
-
 36
36 -
 37
37 -
 38
38 -
 39
39 -
 40
40 -
 41
41 -
 42
42 -
 43
43 -
 44
44 -
 45
45 -
 46
46 -
 47
47 -
 48
48 -
 49
49 -
 50
50 -
 51
51 -
 52
52 -
 53
53 -
 54
54 -
 55
55 -
 56
56 -
57
-
58
-
59
-
60
-
61
-
62
-
63
-
64
-
65
-
66
-
67
-
68
-
69
-
70
-
71
-
72
-
73
-
74
-
75
-
76
-
77
-
78
-
79
-
80
-
81
-
82
-
83
-
84
-
85
-
86
-
87
-
88
-
89
-
90
-
91
-
92
-
93
-
94
-
95
-
96
-
97
-
98
-
99
-
100
-
101
-
102
-
103
-
104
-
105
-
106
-
107
-
108
-
109
-
110
-
111
-
112
-
113
-
114
-
115
-
116
-
117
-
118
-
119
-
120
-
121
-
122
-
123
-
124
-
125
-
126
-
127
-
128
-
129
-
130
-
131
-
132
-
133
-
134
-
135
-
136
-
137
-
138
-
139
-
140
-
141
-
142
 |
 |
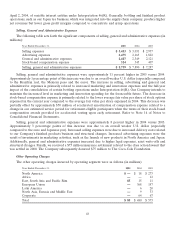
Goodwill, Trademarks and Other Intangible Assets.’’ We will continue to focus on improving our short-term
performance and strengthening our system’s long-term capabilities in Germany. The decrease in gallon sales in
Northwest Europe was primarily due to the soft economic environment and declines in the carbonated soft drink
category, which is associated with a decrease in prices at retailers, and the discount channel becoming a larger
part of the retail market, together with a shift in consumer preferences away from regular carbonated soft drinks
driven by health and wellness trends and the associated public opinion, media and government attention.
The decrease in gallon sales in India was primarily due to the impact of price increases to cover rising raw
material and distribution costs and the lingering effects of the 2003 pesticide allegations. The decline in gallon
sales in the Philippines was primarily due to continued affordability and availability issues. The Company is
continuing to focus on improving our performance in these markets; however, India and the Philippines will
remain difficult during 2006.
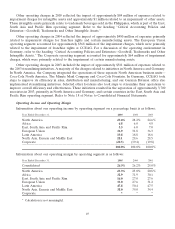
Company-wide gallon sales grew 3 percent while unit case volume grew 4 percent in 2005 compared to 2004.
In the North America operating segment, gallon sales increased 1 percent while unit case volume increased
2 percent in 2005 compared to 2004, primarily due to the impact of higher gallon sales in 2004 related to the
launch of Coca-Cola C2 and a change in shipping routes in 2004. In the Africa operating segment, gallon sales
growth of 7 percent exceeded unit case volume growth of 6 percent, primarily due to timing of gallon shipments.
In the European Union operating segment, gallon sales declined by 1 percent while unit case volume was even in
2005, mostly due to the timing of 2004 gallon sales throughout most of the operating segment and planned
inventory reductions primarily in Spain, Greece and Israel. In the East, South Asia and Pacific Rim operating
segment, gallon sales declines were ahead of unit case volume declines primarily due to timing of gallon sales in
India and the Philippines and planned inventory reductions in Australia. In the North Asia, Eurasia and Middle
East operating segment, unit case volume increased ahead of gallon sales volume due to the joint acquisition of
Multon, which contributed to unit case volume in 2005, along with timing of 2004 gallon sales impacting most of
the remaining divisions in the operating segment. Multon had full year unit case volume of approximately
80 million unit cases in 2004. The Company reports only unit case volume related to Multon, as the Company
does not sell concentrate to Multon. In the Latin America operating segment, gallon sales growth and unit case
volume growth were approximately equal in 2005 compared to 2004.
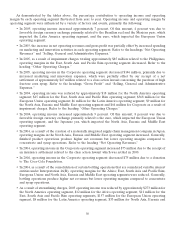
The 2 percent increase in gallon sales in the North America operating segment in 2004 compared to 2003
was primarily related to 4 percent growth in the Foodservice and Hospitality Division and 1 percent growth in
the Retail Division. The 4 percent growth in the Africa operating segment was led mainly by South Africa. The
3 percent increase in the Latin America operating segment was primarily driven by growth in Brazil, Mexico and
Argentina. The North Asia, Eurasia and Middle East operating segment’s growth of 12 percent was driven by
gallon sales growth in China, Turkey and Russia. The 3 percent decrease in gallon sales in the European Union
resulted primarily from the decline in Germany primarily due to market shifts related to the deposit law on
nonrefillable beverage packages and the corresponding lack of availability of our products in the discount retail
channel. The East, South Asia and Pacific Rim operating segment’s gallon sales decreased 2 percent in 2004
compared to 2003 primarily due to inventory reductions in India and challenging conditions in the Philippines.
Company-wide gallon sales growth of 2 percent was in line with unit case volume growth in 2004 compared
to 2003. However, in the North America operating segment, gallon sales increased 2 percent while unit case
volume was even due to lower gallon sales in 2003, additional 2004 shipments related to new product
introductions, changes in our shipping routes and higher than expected year end sales. In the East, South Asia
and Pacific Rim operating segment, gallon sales declined 2 percent while unit case sales increased 1 percent
primarily due to timing of gallon sales.
44