Coca Cola 2005 Annual Report Download - page 48
Download and view the complete annual report
Please find page 48 of the 2005 Coca Cola annual report below. You can navigate through the pages in the report by either clicking on the pages listed below, or by using the keyword search tool below to find specific information within the annual report.-
 1
1 -
2
-
3
-
4
-
5
-
6
-
7
-
8
-
9
-
10
-
11
-
12
-
13
-
14
-
15
-
16
-
17
-
18
-
19
-
20
-
21
-
22
-
23
-
24
-
25
-
26
-
27
-
28
-
29
-
30
-
31
-
32
-
33
-
34
-
35
-
36
-
37
-
 38
38 -
 39
39 -
 40
40 -
 41
41 -
 42
42 -
 43
43 -
 44
44 -
 45
45 -
 46
46 -
 47
47 -
 48
48 -
 49
49 -
 50
50 -
 51
51 -
 52
52 -
 53
53 -
 54
54 -
 55
55 -
 56
56 -
 57
57 -
 58
58 -
59
-
60
-
61
-
62
-
63
-
64
-
65
-
66
-
67
-
68
-
69
-
70
-
71
-
72
-
73
-
74
-
75
-
76
-
77
-
78
-
79
-
80
-
81
-
82
-
83
-
84
-
85
-
86
-
87
-
88
-
89
-
90
-
91
-
92
-
93
-
94
-
95
-
96
-
97
-
98
-
99
-
100
-
101
-
102
-
103
-
104
-
105
-
106
-
107
-
108
-
109
-
110
-
111
-
112
-
113
-
114
-
115
-
116
-
117
-
118
-
119
-
120
-
121
-
122
-
123
-
124
-
125
-
126
-
127
-
128
-
129
-
130
-
131
-
132
-
133
-
134
-
135
-
136
-
137
-
138
-
139
-
140
-
141
-
142
 |
 |

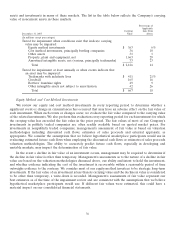
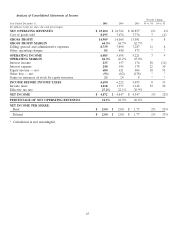
Net Operating Revenues
Net operating revenues increased by $1,362 million or 6 percent in 2005 versus 2004. Net operating
revenues increased by $885 million or 4 percent in 2004 versus 2003.
The following table indicates, on a percentage basis, the estimated impact of key factors resulting in
significant increases (decreases) in net operating revenues:
Percent Change
2005 vs. 2004 2004 vs. 2003
Increase in gallon sales 3% 2%
Structural changes 0 (3)
Price and product/geographic mix 1 0
Impact of currency fluctuations versus the U.S. dollar 2 5
Total percentage increase 6% 4%
Refer to the heading ‘‘Volume’’ for a detailed discussion on gallon sales.
Structural changes refers to acquisitions or dispositions of bottling or canning operations and consolidation
or deconsolidation of entities for accounting purposes. During the third quarter of 2005, our Company acquired
the German soft drink bottling company Bremer Erfrischungsgetraenke GmbH (‘‘Bremer’’). Refer to Note 19 of
Notes to Consolidated Financial Statements. Structural changes also reflect the impact of a full year of revenue
in 2005 for variable interest entities compared to a partial year in 2004. Under Interpretation 46(R), the results
of operations of variable interest entities in which the Company was determined to be the primary beneficiary
were included in our consolidated results beginning April 2, 2004. Refer to Note 1 of Notes to Consolidated
Financial Statements.
The favorable impact of foreign currency fluctuations in 2005 versus 2004 resulted from the strength of
most key foreign currencies versus the U.S. dollar, especially a stronger euro that favorably impacted the
European Union operating segment, and a stronger Brazilian real and Mexican peso that favorably impacted
our Latin America operating segment. The favorable impact of fluctuation in these currencies was offset by a
weaker Japanese yen that unfavorably impacted the North Asia, Eurasia and Middle East operating segment.
Refer to the heading ‘‘Liquidity, Capital Resources and Financial Position—Foreign Exchange.’’
Structural changes resulted in a decrease in net operating revenues in 2004 compared to 2003, primarily due
to the creation of a national supply chain company in Japan in 2003. Effective October 1, 2003, the Company
and all of our bottling partners in Japan created a nationally integrated supply chain management company to
centralize procurement, production and logistics operations for the entire Coca-Cola system in Japan. As a
result, a portion of our Company’s business was essentially converted from a finished product business model to
a concentrate business model. This shift of certain products to a concentrate business model resulted in
reductions in our revenues and cost of goods sold, each in the same amount. This change in the business model
did not impact gross profit. The decrease in net revenues from 2003 to 2004 attributable to the Japan structural
change was approximately $780 million, which was partially offset by an approximately $260 million increase in
revenues associated with the consolidation as of April 2, 2004 of certain bottling operations that are considered
variable interest entities under Interpretation 46(R). Refer to Note 1 of Notes to Consolidated Financial
Statements.
The impact of foreign currency fluctuations versus the U.S. dollar in 2004 versus 2003 was driven primarily
by the stronger euro, which favorably impacted the European Union operating segment, and the stronger
Japanese yen, which favorably impacted the North Asia, Eurasia and Middle East operating segment.
46