Coca Cola 2005 Annual Report Download - page 106
Download and view the complete annual report
Please find page 106 of the 2005 Coca Cola annual report below. You can navigate through the pages in the report by either clicking on the pages listed below, or by using the keyword search tool below to find specific information within the annual report.-
 1
1 -
2
-
3
-
4
-
5
-
6
-
7
-
8
-
9
-
10
-
11
-
12
-
13
-
14
-
15
-
16
-
17
-
18
-
19
-
20
-
21
-
22
-
23
-
24
-
25
-
26
-
27
-
28
-
29
-
30
-
31
-
32
-
33
-
34
-
35
-
36
-
37
-
38
-
39
-
40
-
41
-
42
-
43
-
44
-
45
-
46
-
47
-
48
-
49
-
50
-
51
-
52
-
53
-
54
-
55
-
56
-
57
-
58
-
59
-
60
-
61
-
62
-
63
-
64
-
65
-
66
-
67
-
68
-
69
-
70
-
71
-
72
-
73
-
74
-
75
-
76
-
77
-
78
-
79
-
80
-
81
-
82
-
83
-
84
-
85
-
86
-
87
-
88
-
89
-
90
-
91
-
92
-
93
-
94
-
95
-
 96
96 -
 97
97 -
 98
98 -
 99
99 -
 100
100 -
 101
101 -
 102
102 -
 103
103 -
 104
104 -
 105
105 -
 106
106 -
 107
107 -
 108
108 -
 109
109 -
 110
110 -
 111
111 -
 112
112 -
 113
113 -
 114
114 -
 115
115 -
 116
116 -
117
-
118
-
119
-
120
-
121
-
122
-
123
-
124
-
125
-
126
-
127
-
128
-
129
-
130
-
131
-
132
-
133
-
134
-
135
-
136
-
137
-
138
-
139
-
140
-
141
-
142
 |
 |

THE COCA-COLA COMPANY AND SUBSIDIARIES
NOTES TO CONSOLIDATED FINANCIAL STATEMENTS
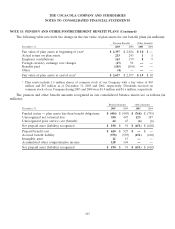
NOTE 15: PENSION AND OTHER POSTRETIREMENT BENEFIT PLANS (Continued)
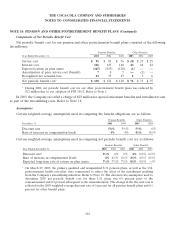
Components of Net Periodic Benefit Cost
Net periodic benefit cost for our pension and other postretirement benefit plans consisted of the following
(in millions):
Pension Benefits Other Benefits
Year Ended December 31, 2005 2004 2003 2005 2004 2003
Service cost $91 $85 $76 $28 $27 $25
Interest cost 156 147 140 43 44 44
Expected return on plan assets (167) (153) (130) (1) ——
Amortization of prior service cost (benefit) 787—(1) —
Recognized net actuarial loss 43 35 27 136
Net periodic benefit cost1$ 130 $ 122 $ 120 $71 $73 $75
1During 2004, net periodic benefit cost for our other postretirement benefit plans was reduced by
$12 million due to our adoption of FSP 106-2. Refer to Note 1.
In 2003, the Company recorded a charge of $23 million for special retirement benefits and curtailment costs
as part of the streamlining costs. Refer to Note 18.
Assumptions
Certain weighted-average assumptions used in computing the benefit obligations are as follows:
Pension Benefits Other Benefits
December 31, 2005 2004 2005 2004
Discount rate 51⁄4%51⁄2%53⁄4%6%
Rate of increase in compensation levels 4% 4% 41⁄2%41⁄2%
Certain weighted-average assumptions used in computing net periodic benefit cost are as follows:
Pension Benefits Other Benefits
Year Ended December 31, 2005 2004 2003 2005 2004 2003
Discount rate151⁄2%6% 6% 6% 61⁄4%6
1⁄2%
Rate of increase in compensation levels 4% 41⁄4%4
1⁄4%41⁄2%41⁄2%4
1⁄2%
Expected long-term rate of return on plan assets 73⁄4%73⁄4%7
3⁄4%81⁄2%81⁄2%—%
1On March 27, 2003, the primary qualified and nonqualified U.S. pension plans, as well as the U.S.
postretirement health care plan, were remeasured to reflect the effect of the curtailment resulting
from the Company’s streamlining initiatives. Refer to Note 18. The discount rate assumption used to
determine 2003 net periodic benefit cost for these U.S. plans was 63⁄4 percent prior to the
remeasurement and 61⁄2 percent subsequent to the remeasurement. This change in the discount rate is
reflected in the 2003 weighted-average discount rate of 6 percent for all pension benefit plans and 61⁄2
percent for other benefit plans.
104