Coca Cola 2005 Annual Report Download - page 56
Download and view the complete annual report
Please find page 56 of the 2005 Coca Cola annual report below. You can navigate through the pages in the report by either clicking on the pages listed below, or by using the keyword search tool below to find specific information within the annual report.-
 1
1 -
2
-
3
-
4
-
5
-
6
-
7
-
8
-
9
-
10
-
11
-
12
-
13
-
14
-
15
-
16
-
17
-
18
-
19
-
20
-
21
-
22
-
23
-
24
-
25
-
26
-
27
-
28
-
29
-
30
-
31
-
32
-
33
-
34
-
35
-
36
-
37
-
38
-
39
-
40
-
41
-
42
-
43
-
44
-
45
-
 46
46 -
 47
47 -
 48
48 -
 49
49 -
 50
50 -
 51
51 -
 52
52 -
 53
53 -
 54
54 -
 55
55 -
 56
56 -
 57
57 -
 58
58 -
 59
59 -
 60
60 -
 61
61 -
 62
62 -
 63
63 -
 64
64 -
 65
65 -
 66
66 -
67
-
68
-
69
-
70
-
71
-
72
-
73
-
74
-
75
-
76
-
77
-
78
-
79
-
80
-
81
-
82
-
83
-
84
-
85
-
86
-
87
-
88
-
89
-
90
-
91
-
92
-
93
-
94
-
95
-
96
-
97
-
98
-
99
-
100
-
101
-
102
-
103
-
104
-
105
-
106
-
107
-
108
-
109
-
110
-
111
-
112
-
113
-
114
-
115
-
116
-
117
-
118
-
119
-
120
-
121
-
122
-
123
-
124
-
125
-
126
-
127
-
128
-
129
-
130
-
131
-
132
-
133
-
134
-
135
-
136
-
137
-
138
-
139
-
140
-
141
-
142
 |
 |

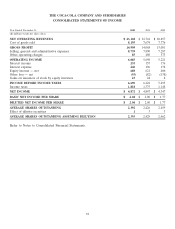
Cash Flows from Operating Activities
Net cash provided by operating activities for the years ended December 31, 2005, 2004 and 2003 was
approximately $6.4 billion, $6.0 billion and $5.5 billion, respectively.
Cash flows from operating activities increased by 8 percent for 2005 compared to 2004. The increase was
primarily related to an increase in cash receipts from customers, which was driven by a 6 percent growth in net
operating revenues. These higher cash collections were offset by increased payments to suppliers and vendors,
including payments related to our increased marketing spending. Our cash flows from operating activities in
2005 also improved versus 2004 as a result of a $137 million reduction in payments related to our 2003
streamlining initiatives. Refer to Note 18 of Notes to Consolidated Financial Statements. Cash flows from
operating activities in the current year were unfavorably impacted by a $176 million increase in income tax
payments primarily related to payment of a portion of the tax provision associated with the repatriation of
previously unremitted foreign earnings under the Jobs Creation Act.
Cash flows from operating activities increased by 9 percent for 2004 compared to 2003. The increase was
primarily related to an increase in cash receipts from customers, which was driven by a 4 percent growth in net
operating revenues. Our cash flows from operating activities in 2004 also improved versus 2003 due to a
$62 million reduction in payments related to our 2003 streamlining initiatives. Refer to Note 18 of Notes to
Consolidated Financial Statements. Cash flows from operating activities in 2004 were unfavorably impacted by a
$175 million increase in income tax payments.
Cash Flows from Investing Activities
Our cash flows used in investing activities are summarized as follows (in millions):
Year Ended December 31, 2005 2004 2003
Cash flows (used in) provided by investing activities:
Acquisitions and investments, principally trademarks and
bottling companies $ (637) $ (267) $ (359)
Purchases of investments and other assets (53) (46) (177)
Proceeds from disposals of investments and other assets 33 161 147
Purchases of property, plant and equipment (899) (755) (812)
Proceeds from disposals of property, plant and equipment 88 341 87
Other investing activities (28) 63 178
Net cash used in investing activities $ (1,496) $ (503) $ (936)
Purchases of property, plant and equipment accounted for the most significant cash outlays for investing
activities in each of the three years ended December 31, 2005. Our Company currently estimates that purchases
of property, plant and equipment in 2006 will be approximately $1.3 billion.
Total capital expenditures for property, plant and equipment (including our investments in information
technology) and the percentage of such totals by operating segment for 2005, 2004 and 2003 were as follows:
Year Ended December 31, 2005 2004 2003
Capital expenditures (in millions) $ 899 $ 755 $ 812
North America 29.5% 32.7% 38.1%
Africa 4.5 3.7 1.6
East, South Asia and Pacific Rim 5.0 5.4 11.2
European Union 24.1 29.8 23.2
Latin America 6.3 5.0 4.3
North Asia, Eurasia and Middle East 14.0 7.9 8.2
Corporate 16.6 15.5 13.4
54