Coca Cola 2005 Annual Report Download - page 94
Download and view the complete annual report
Please find page 94 of the 2005 Coca Cola annual report below. You can navigate through the pages in the report by either clicking on the pages listed below, or by using the keyword search tool below to find specific information within the annual report.-
 1
1 -
2
-
3
-
4
-
5
-
6
-
7
-
8
-
9
-
10
-
11
-
12
-
13
-
14
-
15
-
16
-
17
-
18
-
19
-
20
-
21
-
22
-
23
-
24
-
25
-
26
-
27
-
28
-
29
-
30
-
31
-
32
-
33
-
34
-
35
-
36
-
37
-
38
-
39
-
40
-
41
-
42
-
43
-
44
-
45
-
46
-
47
-
48
-
49
-
50
-
51
-
52
-
53
-
54
-
55
-
56
-
57
-
58
-
59
-
60
-
61
-
62
-
63
-
64
-
65
-
66
-
67
-
68
-
69
-
70
-
71
-
72
-
73
-
74
-
75
-
76
-
77
-
78
-
79
-
80
-
81
-
82
-
83
-
 84
84 -
 85
85 -
 86
86 -
 87
87 -
 88
88 -
 89
89 -
 90
90 -
 91
91 -
 92
92 -
 93
93 -
 94
94 -
 95
95 -
 96
96 -
 97
97 -
 98
98 -
 99
99 -
 100
100 -
 101
101 -
 102
102 -
 103
103 -
 104
104 -
105
-
106
-
107
-
108
-
109
-
110
-
111
-
112
-
113
-
114
-
115
-
116
-
117
-
118
-
119
-
120
-
121
-
122
-
123
-
124
-
125
-
126
-
127
-
128
-
129
-
130
-
131
-
132
-
133
-
134
-
135
-
136
-
137
-
138
-
139
-
140
-
141
-
142
 |
 |

THE COCA-COLA COMPANY AND SUBSIDIARIES
NOTES TO CONSOLIDATED FINANCIAL STATEMENTS
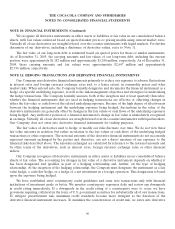
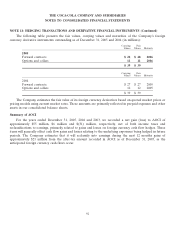
NOTE 11: HEDGING TRANSACTIONS AND DERIVATIVE FINANCIAL INSTRUMENTS (Continued)
The following table presents the fair values, carrying values and maturities of the Company’s foreign
currency derivative instruments outstanding as of December 31, 2005 and 2004 (in millions):
Carrying Fair
Values Values Maturity
2005
Forward contracts $ 28 $ 28 2006
Options and collars 11 11 2006
$39 $39
Carrying Fair
Values Values Maturity
2004
Forward contracts $ 27 $ 27 2005
Options and collars 12 12 2005
$39 $39
The Company estimates the fair value of its foreign currency derivatives based on quoted market prices or
pricing models using current market rates. These amounts are primarily reflected in prepaid expenses and other
assets in our consolidated balance sheets.
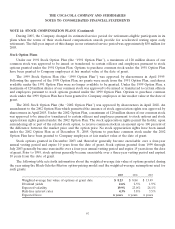
Summary of AOCI
For the years ended December 31, 2005, 2004 and 2003, we recorded a net gain (loss) to AOCI of
approximately $55 million, $6 million and $(31) million, respectively, net of both income taxes and
reclassifications to earnings, primarily related to gains and losses on foreign currency cash flow hedges. These
items will generally offset cash flow gains and losses relating to the underlying exposures being hedged in future
periods. The Company estimates that it will reclassify into earnings during the next 12 months gains of
approximately $21 million from the after-tax amount recorded in AOCI as of December 31, 2005, as the
anticipated foreign currency cash flows occur.
92