Coca Cola 2005 Annual Report Download - page 44
Download and view the complete annual report
Please find page 44 of the 2005 Coca Cola annual report below. You can navigate through the pages in the report by either clicking on the pages listed below, or by using the keyword search tool below to find specific information within the annual report.-
 1
1 -
2
-
3
-
4
-
5
-
6
-
7
-
8
-
9
-
10
-
11
-
12
-
13
-
14
-
15
-
16
-
17
-
18
-
19
-
20
-
21
-
22
-
23
-
24
-
25
-
26
-
27
-
28
-
29
-
30
-
31
-
32
-
33
-
 34
34 -
 35
35 -
 36
36 -
 37
37 -
 38
38 -
 39
39 -
 40
40 -
 41
41 -
 42
42 -
 43
43 -
 44
44 -
 45
45 -
 46
46 -
 47
47 -
 48
48 -
 49
49 -
 50
50 -
 51
51 -
 52
52 -
 53
53 -
 54
54 -
55
-
56
-
57
-
58
-
59
-
60
-
61
-
62
-
63
-
64
-
65
-
66
-
67
-
68
-
69
-
70
-
71
-
72
-
73
-
74
-
75
-
76
-
77
-
78
-
79
-
80
-
81
-
82
-
83
-
84
-
85
-
86
-
87
-
88
-
89
-
90
-
91
-
92
-
93
-
94
-
95
-
96
-
97
-
98
-
99
-
100
-
101
-
102
-
103
-
104
-
105
-
106
-
107
-
108
-
109
-
110
-
111
-
112
-
113
-
114
-
115
-
116
-
117
-
118
-
119
-
120
-
121
-
122
-
123
-
124
-
125
-
126
-
127
-
128
-
129
-
130
-
131
-
132
-
133
-
134
-
135
-
136
-
137
-
138
-
139
-
140
-
141
-
142
 |
 |
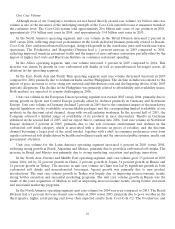
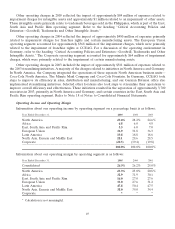
Unit Case Volume
Although most of our Company’s revenues are not based directly on unit case volume, we believe unit case
volume is one of the measures of the underlying strength of the Coca-Cola system because it measures trends at
the consumer level. The Coca-Cola system sold approximately 20.6 billion unit cases of our products in 2005,
approximately 19.8 billion unit cases in 2004, and approximately 19.4 billion unit cases in 2003.
In the North America operating segment, unit case volume in the Retail Division increased 2 percent in
2005 versus 2004, reflecting improved performance in the bottle-delivered business primarily related to Dasani,
Coca-Cola Zero and noncarbonated beverages, along with growth in the warehouse juice and warehouse water
operations. The Foodservice and Hospitality Division had a 1 percent increase in 2005 compared to 2004,
reflecting improved trends in restaurant traffic and the impact of new customer conversion partially offset by the
impact of higher fuel costs and Hurricane Katrina on consumer restaurant spending.
In the Africa operating segment, unit case volume increased 6 percent in 2005 compared to 2004. This
increase was driven by growth in core carbonated soft drinks as well as noncarbonated beverages across all
divisions in this operating segment.
In the East, South Asia and Pacific Rim operating segment, unit case volume decreased 4 percent in 2005
compared to 2004, primarily due to declines in India and the Philippines. The decline in India was related to the
impact of price increases to cover rising raw material and distribution costs and the lingering effects of the 2003
pesticide allegations. The decline in the Philippines was primarily related to affordability and availability issues.
Both markets are expected to remain challenging in 2006.
Unit case volume in the European Union operating segment was even in 2005 versus 2004, primarily due to
strong growth in Spain and Central Europe partially offset by declines primarily in Germany and Northwest
Europe. Unit case volume in Germany declined 2 percent in 2005 due to the continued impact of the mandatory
deposit legislation on the availability of nonrefillable packages and the corresponding limited availability of our
products in the discount retail channel, along with overall industry weakness. In the second half of 2005, the
Company achieved a limited range of availability of its products in most discounters. Results in Germany
stabilized in the second half of 2005, and we expect this to continue into 2006. Unit case volume in Northwest
Europe declined 3 percent in 2005, primarily due to the soft economic environment and declines in the
carbonated soft drink category, which is associated with a decrease in prices at retailers, and the discount
channel becoming a larger part of the retail market, together with a shift in consumer preferences away from
regular carbonated soft drinks driven by health and wellness trends and the associated public opinion, media and
government attention.
Unit case volume for the Latin America operating segment increased 6 percent in 2005 versus 2004,
reflecting strong growth in Brazil, Argentina and Mexico, primarily due to growth in carbonated soft drinks. The
increase in Brazil and Mexico was primarily due to strong marketing, execution and package innovation.
In the North Asia, Eurasia and Middle East operating segment, unit case volume grew 15 percent in 2005
versus 2004, led by 22 percent growth in China, 2 percent growth in Japan, 54 percent growth in Russia and
14 percent growth in Turkey. The increase in unit case volume in China was led by significant growth in both
carbonated soft drinks and noncarbonated beverages. Japan’s growth was primarily due to new product
introductions. The unit case volume growth in Turkey was largely due to improving macroeconomic trends,
strong bottler execution and successful marketing programs. The unit case volume growth in Russia was the
result of the joint acquisition of Multon as well as improving macroeconomic trends, strong bottler execution
and successful marketing programs.
In the North America operating segment, unit case volume for 2004 was even compared to 2003. The Retail
Division had a 1 percent decrease in unit case volume in 2004 versus 2003, primarily due to poor weather in the
third quarter, higher retail pricing and lower than expected results from Coca-Cola C2. The Foodservice and
42