Coca Cola 2005 Annual Report Download - page 43
Download and view the complete annual report
Please find page 43 of the 2005 Coca Cola annual report below. You can navigate through the pages in the report by either clicking on the pages listed below, or by using the keyword search tool below to find specific information within the annual report.-
 1
1 -
2
-
3
-
4
-
5
-
6
-
7
-
8
-
9
-
10
-
11
-
12
-
13
-
14
-
15
-
16
-
17
-
18
-
19
-
20
-
21
-
22
-
23
-
24
-
25
-
26
-
27
-
28
-
29
-
30
-
31
-
32
-
 33
33 -
 34
34 -
 35
35 -
 36
36 -
 37
37 -
 38
38 -
 39
39 -
 40
40 -
 41
41 -
 42
42 -
 43
43 -
 44
44 -
 45
45 -
 46
46 -
 47
47 -
 48
48 -
 49
49 -
 50
50 -
 51
51 -
 52
52 -
 53
53 -
54
-
55
-
56
-
57
-
58
-
59
-
60
-
61
-
62
-
63
-
64
-
65
-
66
-
67
-
68
-
69
-
70
-
71
-
72
-
73
-
74
-
75
-
76
-
77
-
78
-
79
-
80
-
81
-
82
-
83
-
84
-
85
-
86
-
87
-
88
-
89
-
90
-
91
-
92
-
93
-
94
-
95
-
96
-
97
-
98
-
99
-
100
-
101
-
102
-
103
-
104
-
105
-
106
-
107
-
108
-
109
-
110
-
111
-
112
-
113
-
114
-
115
-
116
-
117
-
118
-
119
-
120
-
121
-
122
-
123
-
124
-
125
-
126
-
127
-
128
-
129
-
130
-
131
-
132
-
133
-
134
-
135
-
136
-
137
-
138
-
139
-
140
-
141
-
142
 |
 |

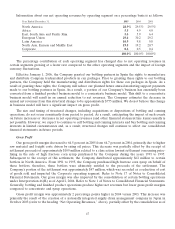
Recent Accounting Standards and Pronouncements
Refer to Note 1 of Notes to Consolidated Financial Statements for a discussion of recent accounting
standards and pronouncements.
Operations Review
We manufacture, distribute and market nonalcoholic beverage concentrates and syrups in more than 200
countries around the world. We also manufacture, distribute and market some finished beverages. Due to our
global presence, we are primarily managed by geographic regions. Our organizational structure as of
December 31, 2005 consisted of the following operating segments, the first six of which are sometimes referred
to as ‘‘operating groups’’ or ‘‘groups’’: North America; Africa; East, South Asia and Pacific Rim; European
Union; Latin America; North Asia, Eurasia and Middle East; and Corporate. For further information regarding
our operating segments, including a discussion of changes made to our operating segments during 2005, refer to
Note 20 of Notes to Consolidated Financial Statements.
Volume
We measure our sales volume in two ways: (1) unit cases of finished products and (2) gallons. A ‘‘unit case’’
is a unit of measurement equal to 192 U.S. fluid ounces of finished beverage (24 eight-ounce servings). Unit case
volume represents the number of unit cases of Company beverage products directly or indirectly sold by the
Coca-Cola system to customers. Unit case volume primarily consists of beverage products bearing Company
trademarks. Also included in unit case volume are certain products licensed to, or distributed by, our Company,
and brands owned by Coca-Cola system bottlers for which our Company provides marketing support and from
the sale of which it derives income. Such products licensed to, or distributed by, our Company or owned by
Coca-Cola system bottlers account for a minimal portion of total unit case volume. In addition, unit case volume
includes sales by joint ventures in which the Company is a partner. Unit case volume is derived based on
estimates supplied by our bottling partners and distributors. A ‘‘gallon’’ is a unit of measurement for
concentrates, syrups, beverage bases, finished beverages and powders (in all cases expressed in equivalent
gallons of syrup) sold by the Company to its bottling partners or other customers. Most of our revenues are
based on gallon sales, a primarily wholesale activity, as discussed under ‘‘Item 1. Business’’ in Part I of this report
and the heading ‘‘Operations Review—Net Operating Revenues,’’ below. Unit case volume and gallon sales
growth rates are not necessarily equal during any given period. Items such as seasonality, bottlers’ inventory
practices, supply point changes, timing of price increases and new product introductions and changes in product
mix can impact unit case volume and gallon sales and can create differences between unit case volume and
gallon sales growth rates.
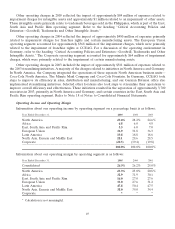
Information about our volume growth by operating segment is as follows:
Percentage Change
2005 vs. 2004 2004 vs. 2003
Year Ended December 31, Unit Cases Gallons Unit Cases Gallons
Worldwide 4% 3% 2% 2%
North America operations 2 1 0 2
International operations—total 5 4 3 2
Africa 6 7 3 4
East, South Asia and Pacific Rim (4) (6) 1 (2)
European Union 0 (1) (3) (3)
Latin America 6 6 3 3
North Asia, Eurasia and Middle East 15 12 12 12
41