Coca Cola 2005 Annual Report Download - page 49
Download and view the complete annual report
Please find page 49 of the 2005 Coca Cola annual report below. You can navigate through the pages in the report by either clicking on the pages listed below, or by using the keyword search tool below to find specific information within the annual report.-
 1
1 -
2
-
3
-
4
-
5
-
6
-
7
-
8
-
9
-
10
-
11
-
12
-
13
-
14
-
15
-
16
-
17
-
18
-
19
-
20
-
21
-
22
-
23
-
24
-
25
-
26
-
27
-
28
-
29
-
30
-
31
-
32
-
33
-
34
-
35
-
36
-
37
-
38
-
 39
39 -
 40
40 -
 41
41 -
 42
42 -
 43
43 -
 44
44 -
 45
45 -
 46
46 -
 47
47 -
 48
48 -
 49
49 -
 50
50 -
 51
51 -
 52
52 -
 53
53 -
 54
54 -
 55
55 -
 56
56 -
 57
57 -
 58
58 -
 59
59 -
60
-
61
-
62
-
63
-
64
-
65
-
66
-
67
-
68
-
69
-
70
-
71
-
72
-
73
-
74
-
75
-
76
-
77
-
78
-
79
-
80
-
81
-
82
-
83
-
84
-
85
-
86
-
87
-
88
-
89
-
90
-
91
-
92
-
93
-
94
-
95
-
96
-
97
-
98
-
99
-
100
-
101
-
102
-
103
-
104
-
105
-
106
-
107
-
108
-
109
-
110
-
111
-
112
-
113
-
114
-
115
-
116
-
117
-
118
-
119
-
120
-
121
-
122
-
123
-
124
-
125
-
126
-
127
-
128
-
129
-
130
-
131
-
132
-
133
-
134
-
135
-
136
-
137
-
138
-
139
-
140
-
141
-
142
 |
 |

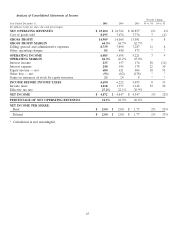
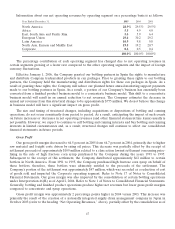
Information about our net operating revenues by operating segment on a percentage basis is as follows:
Year Ended December 31, 2005 2004 2003
North America 28.9% 29.5% 29.5%
Africa 5.5 4.9 4.0
East, South Asia and Pacific Rim 5.4 5.9 6.4
European Union 29.4 30.2 29.2
Latin America 10.9 9.8 9.8
North Asia, Eurasia and Middle East 19.5 19.2 20.7
Corporate 0.4 0.5 0.4
100.0% 100.0% 100.0%
The percentage contribution of each operating segment has changed due to net operating revenues in
certain segments growing at a faster rate compared to the other operating segments and the impact of foreign
currency fluctuations.
Effective January 1, 2006, the Company granted our bottling partners in Spain the rights to manufacture
and distribute Company trademarked products in can packages. Prior to granting these rights to our bottling
partners, the Company held the manufacturing and distribution rights for these can packages in Spain. As a
result of granting these rights, the Company will reduce our planned future annual marketing support payments
made to our bottling partners in Spain. As a result, a portion of our Company’s business has essentially been
converted from a finished product business model to a concentrate business model. This shift to a concentrate
business model will result in an annual reduction to net revenues. The Company estimates the decrease in
annual net revenues from this structural change to be approximately $775 million. We do not believe this change
in business model will have a significant impact on gross profit.
The size and timing of structural changes, including acquisitions or dispositions of bottling and canning
operations, do not occur consistently from period to period. As a result, anticipating the impact of such events
on future increases or decreases in net operating revenues (and other financial statement line items) usually is
not possible. However, we expect to continue to sell bottling and canning interests and buy bottling and canning
interests in limited circumstances and, as a result, structural changes will continue to affect our consolidated
financial statements in future periods.
Gross Profit
Our gross profit margin decreased to 64.5 percent in 2005 from 64.7 percent in 2004, primarily due to higher
raw material and freight costs driven by rising oil prices. This decrease was partially offset by the receipt of
settlement proceeds of approximately $109 million related to a class action lawsuit settlement concerning price-
fixing in the sale of high fructose corn syrup purchased by the Company during the years 1991 to 1995.
Subsequent to the receipt of this settlement, the Company distributed approximately $62 million to certain
bottlers in North America. From 1991 to 1995, the Company purchased high fructose corn syrup on behalf of
these bottlers; therefore, these bottlers were ultimately entitled to the proceeds of the settlement. The
Company’s portion of the settlement was approximately $47 million, which was recorded as a reduction of cost
of goods sold and impacted the Corporate operating segment. Refer to Note 17 of Notes to Consolidated
Financial Statements. Our gross margin was also impacted by the consolidation of certain bottling operations
under Interpretation 46(R) as of April 2, 2004. Refer to Note 1 of Notes to Consolidated Financial Statements.
Generally, bottling and finished product operations produce higher net revenues but lower gross profit margins
compared to concentrate and syrup operations.
Gross profit margin was approximately 2 percentage points higher in 2004 versus 2003. This increase was
primarily the result of the creation of a nationally integrated supply chain management company in Japan in
October 2003 (refer to the heading ‘‘Net Operating Revenues,’’ above), partially offset by the consolidation as of
47