LabCorp 2014 Annual Report Download - page 108
Download and view the complete annual report
Please find page 108 of the 2014 LabCorp annual report below. You can navigate through the pages in the report by either clicking on the pages listed below, or by using the keyword search tool below to find specific information within the annual report.-
 1
1 -
2
-
3
-
4
-
5
-
6
-
7
-
8
-
9
-
10
-
11
-
12
-
13
-
14
-
15
-
16
-
17
-
18
-
19
-
20
-
21
-
22
-
23
-
24
-
25
-
26
-
27
-
28
-
29
-
30
-
31
-
32
-
33
-
34
-
35
-
36
-
37
-
38
-
39
-
40
-
41
-
42
-
43
-
44
-
45
-
46
-
47
-
48
-
49
-
50
-
51
-
52
-
53
-
54
-
55
-
56
-
57
-
58
-
59
-
60
-
61
-
62
-
63
-
64
-
65
-
66
-
67
-
68
-
69
-
70
-
71
-
72
-
73
-
74
-
75
-
76
-
77
-
78
-
79
-
80
-
81
-
82
-
83
-
84
-
85
-
86
-
87
-
88
-
89
-
90
-
91
-
92
-
93
-
94
-
95
-
96
-
97
-
 98
98 -
 99
99 -
 100
100 -
 101
101 -
 102
102 -
 103
103 -
 104
104 -
 105
105 -
 106
106 -
 107
107 -
 108
108 -
 109
109 -
 110
110 -
 111
111 -
 112
112 -
 113
113 -
 114
114 -
 115
115 -
 116
116 -
 117
117 -
 118
118 -
119
-
120
-
121
-
122
-
123
-
124
-
125
-
126
-
127
-
128
 |
 |

F-29
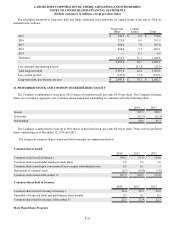
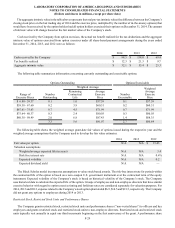
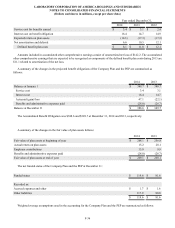
The aggregate intrinsic value in the table above represents the total pre-tax intrinsic value (the difference between the Company’s
closing stock price on the last trading day of 2014 and the exercise price, multiplied by the number of in-the-money options) that
would have been received by the option holders had all option holders exercised their options on December 31, 2014. The amount
of intrinsic value will change based on the fair market value of the Company’s stock.
Cash received by the Company from option exercises, the actual tax benefit realized for the tax deductions and the aggregate
intrinsic value of options exercised from option exercises under all share-based payment arrangements during the years ended
December 31, 2014, 2013, and 2012 were as follows:
2014 2013 2012
Cash received by the Company $ 98.5 $ 158.0 $ 69.4
Tax benefits realized $ 12.3 $ 21.3 $ 9.7
Aggregate intrinsic value $ 32.1 $ 55.4 $ 25.3
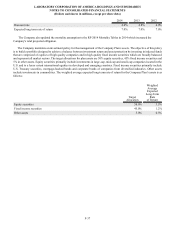
The following table summarizes information concerning currently outstanding and exercisable options.
Options Outstanding Options Exercisable
Range of
Exercise Prices Number
Outstanding
Weighted Average
Number
Exercisable
Weighted
Average
Exercise
Price
Remaining
Contractual
Life
Average
Exercise
Price
$ 6.80 - 59.37 0.1 1.0 $57.59 0.1 $57.59
$59.38 - 67.60 0.2 3.9 $60.51 0.2 $60.51
$67.61 - 75.63 0.7 4.5 $71.99 0.7 $71.99
$75.64 - 80.37 0.3 2.4 $80.03 0.3 $80.03
$80.38 - 98.49 2.0 6.8 $87.43 1.4 $88.35
3.3 5.6 $81.07 2.7 $80.84
The following table shows the weighted average grant-date fair values of options issued during the respective year and the
weighted average assumptions that the Company used to develop the fair value estimates:
2014 2013 2012
Fair value per option N/A N/A $ 13.43
Valuation assumptions
Weighted average expected life (in years) N/A N/A 3.4
Risk free interest rate N/A N/A 0.4%
Expected volatility N/A N/A 0.2
Expected dividend yield N/A N/A —
The Black Scholes model incorporates assumptions to value stock-based awards. The risk-free interest rate for periods within
the contractual life of the option is based on a zero-coupon U.S. government instrument over the contractual term of the equity
instrument. Expected volatility of the Company’s stock is based on historical volatility of the Company’s stock. The Company
uses historical data to calculate the expected life of the option. Groups of employees and non-employee directors that have similar
exercise behavior with regard to option exercise timing and forfeiture rates are considered separately for valuation purposes. For
2014, 2013 and 2012, expense related to the Company’s stock option plan totaled $6.9, $14.5 and $21.5, respectively. The Company
did not grant any options to employees during 2014 or 2013.
Restricted Stock, Restricted Stock Units and Performance Shares
The Company grants restricted stock, restricted stock units and performance shares (“non-vested shares”) to officers and key
employees and grants restricted stock and restricted stock units to non-employee directors. Restricted stock and restricted stock
units typically vest annually in equal one third increments beginning on the first anniversary of the grant. A performance share
LABORATORY CORPORATION OF AMERICA HOLDINGS AND SUBSIDIARIES
NOTES TO CONSOLIDATED FINANCIAL STATEMENTS
(Dollars and shares in millions, except per share data)