LabCorp 2014 Annual Report Download - page 50
Download and view the complete annual report
Please find page 50 of the 2014 LabCorp annual report below. You can navigate through the pages in the report by either clicking on the pages listed below, or by using the keyword search tool below to find specific information within the annual report.-
 1
1 -
2
-
3
-
4
-
5
-
6
-
7
-
8
-
9
-
10
-
11
-
12
-
13
-
14
-
15
-
16
-
17
-
18
-
19
-
20
-
21
-
22
-
23
-
24
-
25
-
26
-
27
-
28
-
29
-
30
-
31
-
32
-
33
-
34
-
35
-
36
-
37
-
38
-
39
-
 40
40 -
 41
41 -
 42
42 -
 43
43 -
 44
44 -
 45
45 -
 46
46 -
 47
47 -
 48
48 -
 49
49 -
 50
50 -
 51
51 -
 52
52 -
 53
53 -
 54
54 -
 55
55 -
 56
56 -
 57
57 -
 58
58 -
 59
59 -
 60
60 -
61
-
62
-
63
-
64
-
65
-
66
-
67
-
68
-
69
-
70
-
71
-
72
-
73
-
74
-
75
-
76
-
77
-
78
-
79
-
80
-
81
-
82
-
83
-
84
-
85
-
86
-
87
-
88
-
89
-
90
-
91
-
92
-
93
-
94
-
95
-
96
-
97
-
98
-
99
-
100
-
101
-
102
-
103
-
104
-
105
-
106
-
107
-
108
-
109
-
110
-
111
-
112
-
113
-
114
-
115
-
116
-
117
-
118
-
119
-
120
-
121
-
122
-
123
-
124
-
125
-
126
-
127
-
128
 |
 |
48
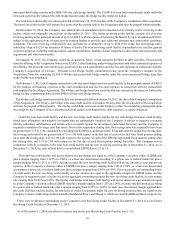
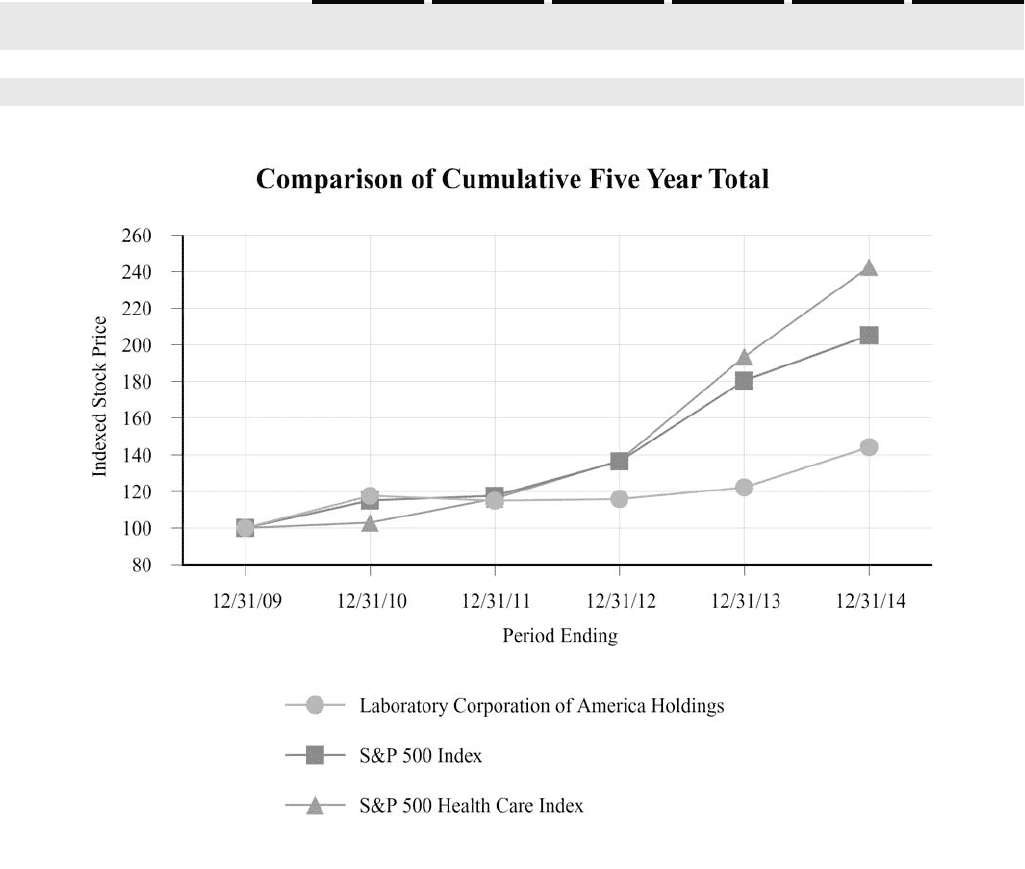
Common Stock Performance
The Company’s common stock is traded on the NYSE. The graph below shows the cumulative total return assuming an
investment of $100 on December 31, 2009 in each of the Company’s common stock, the Standard & Poor’s (the “S&P”)
Composite-500 Stock Index and the S&P 500 Health Care Index (the “Peer Group”) and assuming that all dividends were reinvested.
Comparison of Five Year Cumulative Total Return
12/2009 12/2010 12/2011 12/2012 12/2013 12/2014
Laboratory Corporation of America
Holdings $ 100 $ 117.48 $ 114.87 $ 115.74 $ 122.09 $ 144.17
S&P 500 Index $ 100 $ 115.06 $ 117.49 $ 136.30 $ 180.44 $ 205.14
S&P 500 Health Care Index $ 100 $ 102.90 $ 116.00 $ 136.75 $ 193.45 $ 242.46