LabCorp 2014 Annual Report Download - page 87
Download and view the complete annual report
Please find page 87 of the 2014 LabCorp annual report below. You can navigate through the pages in the report by either clicking on the pages listed below, or by using the keyword search tool below to find specific information within the annual report.-
 1
1 -
2
-
3
-
4
-
5
-
6
-
7
-
8
-
9
-
10
-
11
-
12
-
13
-
14
-
15
-
16
-
17
-
18
-
19
-
20
-
21
-
22
-
23
-
24
-
25
-
26
-
27
-
28
-
29
-
30
-
31
-
32
-
33
-
34
-
35
-
36
-
37
-
38
-
39
-
40
-
41
-
42
-
43
-
44
-
45
-
46
-
47
-
48
-
49
-
50
-
51
-
52
-
53
-
54
-
55
-
56
-
57
-
58
-
59
-
60
-
61
-
62
-
63
-
64
-
65
-
66
-
67
-
68
-
69
-
70
-
71
-
72
-
73
-
74
-
75
-
76
-
 77
77 -
 78
78 -
 79
79 -
 80
80 -
 81
81 -
 82
82 -
 83
83 -
 84
84 -
 85
85 -
 86
86 -
 87
87 -
 88
88 -
 89
89 -
 90
90 -
 91
91 -
 92
92 -
 93
93 -
 94
94 -
 95
95 -
 96
96 -
 97
97 -
98
-
99
-
100
-
101
-
102
-
103
-
104
-
105
-
106
-
107
-
108
-
109
-
110
-
111
-
112
-
113
-
114
-
115
-
116
-
117
-
118
-
119
-
120
-
121
-
122
-
123
-
124
-
125
-
126
-
127
-
128
 |
 |

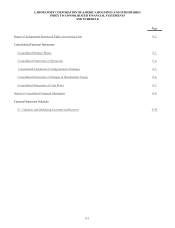
F-8
1. SUMMARY OF SIGNIFICANT ACCOUNTING POLICIES
Basis of Financial Statement Presentation
Laboratory Corporation of America Holdings and its subsidiaries (the “Company”) is the second largest independent clinical
laboratory company in the U.S. based on 2014 net revenues. Through a national network of laboratories, the Company offers a
broad range of clinical laboratory testing services used by the medical profession in core testing, patient diagnosis, and in the
monitoring and treatment of disease. In addition, the Company has developed specialty testing operations, such as oncology testing,
HIV genotyping and phenotyping, diagnostic genetics, cardiovascular disease risk assessment, HIV diagnosis and monitoring,
and clinical trials.
Since its founding in 1971, the Company has grown into a network of 39 primary laboratories and over 1,750 patient service
centers along with a network of branches and STAT laboratories. With over 36,000 employees, the Company processes tests on
approximately 500,000 patient specimens daily and has laboratory locations throughout the United States and other countries
including, Belgium, Canada, China, Japan, Singapore, the United Kingdom and the United Arab Emirates. As of December 31,
2014, the Company operated within two reportable segments based on the way the Company manages its business.
The consolidated financial statements include the accounts of the Company and its majority-owned subsidiaries for which it
exercises control. Long-term investments in affiliated companies in which the Company exercises significant influence, but which
it does not control, are accounted for using the equity method. Investments in which the Company does not exercise significant
influence (generally, when the Company has an investment of less than 20% and no representation on the investee's board of
directors) are accounted for using the cost method. All significant inter-company transactions and accounts have been eliminated.
The Company does not have any variable interest entities or special purpose entities whose financial results are not included in
the consolidated financial statements.
The financial statements of the Company's foreign subsidiaries are measured using the local currency as the functional
currency. Assets and liabilities are translated at exchange rates as of the balance sheet date. Revenues and expenses are translated
at average monthly exchange rates prevailing during the year. Resulting translation adjustments are included in "Accumulated
other comprehensive income.”
Revenue Recognition
Sales are recognized on the accrual basis at the time test results are reported, which approximates when services are provided.
Services are provided to certain patients covered by various third-party payer programs including various managed care
organizations, as well as the Medicare and Medicaid programs. Billings for services under third-party payer programs are included
in sales net of allowances for contractual discounts and allowances for differences between the amounts billed and estimated
program payment amounts. Adjustments to the estimated payment amounts based on final settlement with the programs are recorded
upon settlement as an adjustment to revenue. In 2014, 2013 and 2012, approximately 15.0%, 16.0% and 17.6%, respectively, of
the Company's revenues were derived directly from the Medicare and Medicaid programs. The Company has capitated agreements
with certain managed care customers and recognizes related revenue based on a predetermined monthly contractual rate for each
member of the managed care plan regardless of the number or cost of services provided by the Company. In 2014, 2013 and 2012,
approximately 3.5%, 3.2% and 3.0%, respectively, of the Company's revenues were derived from such capitated agreements.
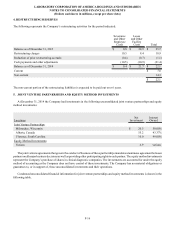
The Company's net sales are comprised of the following:
Years Ended December 31,
Net sales 2014 2013 2012
Clinical diagnostics laboratory:
Core Testing $ 3,656.6 $ 3,445.1 $ 3,246.6
Genomic and Esoteric Testing 2,025.6 2,020.1 2,089.8
Other 329.4 343.1 335.0
Total $ 6,011.6 $ 5,808.3 $ 5,671.4