LabCorp 2014 Annual Report Download - page 55
Download and view the complete annual report
Please find page 55 of the 2014 LabCorp annual report below. You can navigate through the pages in the report by either clicking on the pages listed below, or by using the keyword search tool below to find specific information within the annual report.-
 1
1 -
2
-
3
-
4
-
5
-
6
-
7
-
8
-
9
-
10
-
11
-
12
-
13
-
14
-
15
-
16
-
17
-
18
-
19
-
20
-
21
-
22
-
23
-
24
-
25
-
26
-
27
-
28
-
29
-
30
-
31
-
32
-
33
-
34
-
35
-
36
-
37
-
38
-
39
-
40
-
41
-
42
-
43
-
44
-
 45
45 -
 46
46 -
 47
47 -
 48
48 -
 49
49 -
 50
50 -
 51
51 -
 52
52 -
 53
53 -
 54
54 -
 55
55 -
 56
56 -
 57
57 -
 58
58 -
 59
59 -
 60
60 -
 61
61 -
 62
62 -
 63
63 -
 64
64 -
 65
65 -
66
-
67
-
68
-
69
-
70
-
71
-
72
-
73
-
74
-
75
-
76
-
77
-
78
-
79
-
80
-
81
-
82
-
83
-
84
-
85
-
86
-
87
-
88
-
89
-
90
-
91
-
92
-
93
-
94
-
95
-
96
-
97
-
98
-
99
-
100
-
101
-
102
-
103
-
104
-
105
-
106
-
107
-
108
-
109
-
110
-
111
-
112
-
113
-
114
-
115
-
116
-
117
-
118
-
119
-
120
-
121
-
122
-
123
-
124
-
125
-
126
-
127
-
128
 |
 |

53
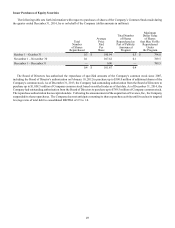
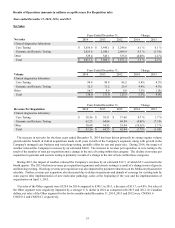
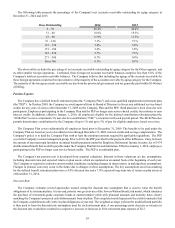
Results of Operations (amounts in millions except Revenue Per Requisition info)
Years ended December 31, 2014, 2013, and 2012
Net Sales
Years Ended December 31, Change
Net sales 2014 2013 2012 2014 2013
Clinical diagnostics laboratory:
Core Testing $ 3,656.6 $ 3,445.1 $ 3,246.6 6.1 % 6.1 %
Genomic and Esoteric Testing 2,025.6 2,020.1 2,089.8 0.3 % (3.3)%
Other 329.4 343.1 335.0 (4.0)% 2.4 %
Total $ 6,011.6 $ 5,808.3 $ 5,671.4 3.5 % 2.4 %
Years Ended December 31, Change
Volume 2014 2013 2012 2014 2013
Clinical diagnostics laboratory:
Core Testing 94.8 89.9 86.2 5.4% 4.3%
Genomic and Esoteric Testing 32.5 31.2 29.9 4.4% 4.3%
Other 10.7 9.9 9.8 7.3% 1.0%
Total 138.0 131.0 125.9 5.3% 4.0%
Years Ended December 31, Change
Revenue Per Requisition 2014 2013 2012 2014 2013
Clinical diagnostics laboratory:
Core Testing $ 38.56 $ 38.31 $ 37.68 0.7 % 1.7 %
Genomic and Esoteric Testing 62.25 64.84 69.94 (4.0)% (7.3)%
Other 30.89 34.53 33.94 (10.5)% 1.7 %
Total $ 43.56 $ 44.33 $ 45.04 (1.7)% (1.6)%
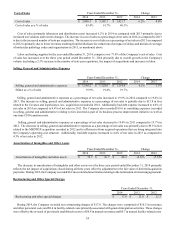
The increase in net sales for the three years ended December 31, 2014 has been driven primarily by strong organic volume
growth and the benefit of fold-in acquisitions made in all years in both of the Company's segments, along with growth in the
Company's managed care business and toxicology testing, partially offset by test and payer mix. During 2014, the impact of
weather reduced the Company's revenues by an estimated $40.0. The increase in revenue per requisition in core testing is the
result of the number of tests per requisition and a change in the mix of testing within that category. The decline in revenue per
requisition in genomic and esoteric testing is primarily a result of a change in the mix of tests within those categories.
During 2013, the impact of weather, reduced the Company's revenues by an estimated $12.7, of which $5.3 occurred in the
fourth quarter. The 2013 decline in revenue per requisition in genomic and esoteric testing is a result of a change in mix of genetic
and histology testing. Histology revenue per requisition was also impacted by payment reductions on the Medicare physician fee
schedule. Further, revenue per requisition also decreased due to delays in payments and denials of coverage for existing tests by
some payers after implementation of new molecular pathology codes at the beginning of the year and the implementation of
sequestration on April 1, 2013.
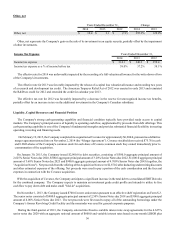
Net sales of the Other segment were $329.4 for 2014 compared to $343.1 in 2013, a decrease of $13.7, or 4.0%. Net sales of
the Other segment were negatively impacted by a stronger U.S. dollar in 2014 as compared with 2013 and 2012. In Canadian
dollars, net sales of the Other segment for the twelve months ended December 31, 2014, 2013 and 2012 were CN$363.6
CN$353.2 and CN$334.7, respectively.