LabCorp 2014 Annual Report Download - page 117
Download and view the complete annual report
Please find page 117 of the 2014 LabCorp annual report below. You can navigate through the pages in the report by either clicking on the pages listed below, or by using the keyword search tool below to find specific information within the annual report.-
 1
1 -
2
-
3
-
4
-
5
-
6
-
7
-
8
-
9
-
10
-
11
-
12
-
13
-
14
-
15
-
16
-
17
-
18
-
19
-
20
-
21
-
22
-
23
-
24
-
25
-
26
-
27
-
28
-
29
-
30
-
31
-
32
-
33
-
34
-
35
-
36
-
37
-
38
-
39
-
40
-
41
-
42
-
43
-
44
-
45
-
46
-
47
-
48
-
49
-
50
-
51
-
52
-
53
-
54
-
55
-
56
-
57
-
58
-
59
-
60
-
61
-
62
-
63
-
64
-
65
-
66
-
67
-
68
-
69
-
70
-
71
-
72
-
73
-
74
-
75
-
76
-
77
-
78
-
79
-
80
-
81
-
82
-
83
-
84
-
85
-
86
-
87
-
88
-
89
-
90
-
91
-
92
-
93
-
94
-
95
-
96
-
97
-
98
-
99
-
100
-
101
-
102
-
103
-
104
-
105
-
106
-
 107
107 -
 108
108 -
 109
109 -
 110
110 -
 111
111 -
 112
112 -
 113
113 -
 114
114 -
 115
115 -
 116
116 -
 117
117 -
 118
118 -
 119
119 -
 120
120 -
 121
121 -
 122
122 -
 123
123 -
 124
124 -
 125
125 -
 126
126 -
 127
127 -
128
 |
 |

F-38
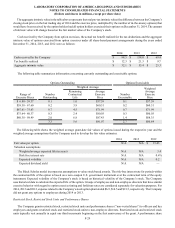
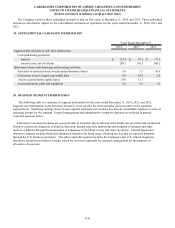
The fair values of the Company Plan’s assets at December 31, 2014 and 2013, by asset category are as follows:
Fair Value Measurements as of
December 31, 2014
Fair Value as
of December
31, 2014
Using Fair Value Hierarchy
Asset Category Level 1 Level 2 Level 3
Cash $ 4.1 $ 4.1 $ — $ —
Equity securities:
U.S. large cap - blend (a) 64.1 — 64.1 —
U.S. mid cap - blend (b) 25.3 — 25.3 —
U.S. small cap - blend (c) 7.9 — 7.9 —
International equity - blend (d) 36.0 — 36.0 —
Commodities index (e) 10.3 — 10.3 —
Fixed income securities:
U.S. fixed income (f) 115.1 — 115.1 —
U.S inflation protection income (g) 6.3 — 6.3 —
Total fair value of the Company Plan’s assets $ 269.1 $ 4.1 $ 265.0 $ —
Fair Value Measurements as of
December 31, 2013
Fair Value as
of December
31, 2013
Using Fair Value Hierarchy
Asset Category Level 1 Level 2 Level 3
Cash $ 2.7 $ 2.7 $ — $ —
Equity securities:
U.S. large cap - blend (a) 65.5 — 65.5 —
U.S. mid cap - blend (b) 25.1 — 25.1 —
U.S. small cap - blend (c) 8.1 — 8.1 —
International equity - blend (d) 40.3 — 40.3 —
Commodities index (e) 11.3 — 11.3 —
Fixed income securities:
U.S. fixed income (f) 104.1 — 104.1 —
U.S inflation protection income (g) 11.0 11.0
Total fair value of the Company Plan’s assets $ 268.1 $ 2.7 $ 265.4 $ —
a) This category represents an equity index fund not actively managed that tracks the S&P 500 Index.
b) This category represents an equity index fund not actively managed that tracks the S&P mid-cap 400 Index.
c) This category represents an equity index fund not actively managed that tracks the Russell 2000 Index.
d) This category represents an equity index fund not actively managed that tracks the MSCI ACWI ex USA Index.
e) This category represents a commodities index fund not actively managed that tracks the Dow Jones - UBS Commodity
Index.
f) This category primarily represents bond index funds not actively managed that track the Barclays Capital U.S.
Aggregate Index and Barclays Capital U.S. TIPS Index.
g) This category primarily represents a bond index fund not actively managed that tracks the Barclays Capital U.S. TIPS
Index.
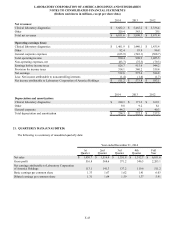
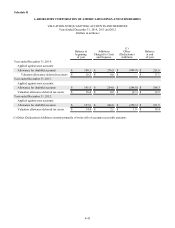
LABORATORY CORPORATION OF AMERICA HOLDINGS AND SUBSIDIARIES
NOTES TO CONSOLIDATED FINANCIAL STATEMENTS
(Dollars and shares in millions, except per share data)