LabCorp 2014 Annual Report Download - page 52
Download and view the complete annual report
Please find page 52 of the 2014 LabCorp annual report below. You can navigate through the pages in the report by either clicking on the pages listed below, or by using the keyword search tool below to find specific information within the annual report.-
 1
1 -
2
-
3
-
4
-
5
-
6
-
7
-
8
-
9
-
10
-
11
-
12
-
13
-
14
-
15
-
16
-
17
-
18
-
19
-
20
-
21
-
22
-
23
-
24
-
25
-
26
-
27
-
28
-
29
-
30
-
31
-
32
-
33
-
34
-
35
-
36
-
37
-
38
-
39
-
40
-
41
-
 42
42 -
 43
43 -
 44
44 -
 45
45 -
 46
46 -
 47
47 -
 48
48 -
 49
49 -
 50
50 -
 51
51 -
 52
52 -
 53
53 -
 54
54 -
 55
55 -
 56
56 -
 57
57 -
 58
58 -
 59
59 -
 60
60 -
 61
61 -
 62
62 -
63
-
64
-
65
-
66
-
67
-
68
-
69
-
70
-
71
-
72
-
73
-
74
-
75
-
76
-
77
-
78
-
79
-
80
-
81
-
82
-
83
-
84
-
85
-
86
-
87
-
88
-
89
-
90
-
91
-
92
-
93
-
94
-
95
-
96
-
97
-
98
-
99
-
100
-
101
-
102
-
103
-
104
-
105
-
106
-
107
-
108
-
109
-
110
-
111
-
112
-
113
-
114
-
115
-
116
-
117
-
118
-
119
-
120
-
121
-
122
-
123
-
124
-
125
-
126
-
127
-
128
 |
 |
50
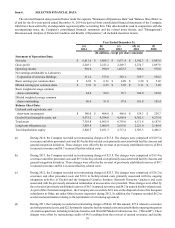
Item 6. SELECTED FINANCIAL DATA
The selected financial data presented below under the captions "Statement of Operations Data" and "Balance Sheet Data" as
of and for the five-year period ended December 31, 2014 are derived from consolidated financial statements of the Company,
which have been audited by an independent registered public accounting firm. This data should be read in conjunction with the
accompanying notes, the Company's consolidated financial statements and the related notes thereto, and "Management's
Discussion and Analysis of Financial Condition and Results of Operations," all included elsewhere herein.
Year Ended December 31,
(a)
2014
(b)
2013
(c)
2012
(d) (e)
2011
(f)
2010
(In millions, except per share amounts)
Statement of Operations Data:
Net sales $ 6,011.6 $ 5,808.3 $ 5,671.4 $ 5,542.3 $ 5,003.9
Gross profit 2,203.1 2,223.2 2,249.7 2,274.7 2,097.8
Operating income 910.4 990.9 1,023.5 948.4 978.8
Net earnings attributable to Laboratory
Corporation of America Holdings 511.2 573.8 583.1 519.7 558.2
Basic earnings per common share $ 6.03 $ 6.36 $ 6.09 $ 5.20 $ 5.42
Diluted earnings per common share $ 5.91 $ 6.25 $ 5.99 $ 5.11 $ 5.29
Basic weighted average common
shares outstanding 84.8 90.2 95.7 100.0 103.0
Diluted weighted average common
shares outstanding 86.4 91.8 97.4 101.8 105.4
Balance Sheet Data:
Cash and cash equivalents, and
short-term investments $ 580.0 $ 404.0 $ 466.8 $ 159.3 $ 230.7
Goodwill and intangible assets, net 4,575.2 4,594.8 4,569.4 4,302.5 4,275.4
Total assets 7,301.8 6,965.9 6,795.0 6,111.8 6,187.8
Long-term obligations (g) 3,029.8 3,000.4 2,655.0 2,221.0 2,188.4
Total shareholders' equity 2,820.5 2,491.3 2,717.4 2,503.5 2,466.3
(a) During 2014, the Company recorded net restructuring charges of $17.8. The charges were comprised of $10.5 in
severance and other personnel costs and $8.4 in facility-related costs primarily associated with facility closures and
general integration initiatives. These charges were offset by the reversal of previously established reserves of $0.4
in unused severance and $0.7 in unused facility-related costs.
(b) During 2013, the Company recorded net restructuring charges of $21.8. The charges were comprised of $15.4 in
severance and other personnel costs and $9.5 in facility-related costs primarily associated with facility closures and
general integration initiatives. These charges were offset by the reversal of previously established reserves of $0.7
in unused severance and $2.4 in unused facility-related costs.
(c) During 2012, the Company recorded net restructuring charges of $25.3. The charges were comprised of $16.2 in
severance and other personnel costs and $19.6 in facility-related costs primarily associated with the ongoing
integration activities of Orchid and the Integrated Genetics business (formerly Genzyme Genetics) and costs
associated with the previously announced termination of an executive vice president. These charges were offset by
the reversal of previously established reserves of $6.3 in unused severance and $4.2 in unused facility-related costs.
As part of the Clearstone integration, the Company also recorded a $6.9 loss on the disposal of one of its European
subsidiaries in Other, net under Other income (expenses) during 2012. In addition, the Company recorded $6.2 in
accelerated amortization relating to the termination of a licensing agreement.
(d) During 2011, the Company recorded net restructuring charges of $44.6. Of this amount, $27.4 related to severance
and other personnel costs, and $22.0 primarily related to facility-related costs associated with the ongoing integration
of certain acquisitions including Genzyme Genetics and Westcliff Medical Laboratories, Inc. ("Westcliff"). These
charges were offset by restructuring credits of $4.8 resulting from the reversal of unused severance and facility