LabCorp 2014 Annual Report Download - page 56
Download and view the complete annual report
Please find page 56 of the 2014 LabCorp annual report below. You can navigate through the pages in the report by either clicking on the pages listed below, or by using the keyword search tool below to find specific information within the annual report.-
 1
1 -
2
-
3
-
4
-
5
-
6
-
7
-
8
-
9
-
10
-
11
-
12
-
13
-
14
-
15
-
16
-
17
-
18
-
19
-
20
-
21
-
22
-
23
-
24
-
25
-
26
-
27
-
28
-
29
-
30
-
31
-
32
-
33
-
34
-
35
-
36
-
37
-
38
-
39
-
40
-
41
-
42
-
43
-
44
-
45
-
 46
46 -
 47
47 -
 48
48 -
 49
49 -
 50
50 -
 51
51 -
 52
52 -
 53
53 -
 54
54 -
 55
55 -
 56
56 -
 57
57 -
 58
58 -
 59
59 -
 60
60 -
 61
61 -
 62
62 -
 63
63 -
 64
64 -
 65
65 -
 66
66 -
67
-
68
-
69
-
70
-
71
-
72
-
73
-
74
-
75
-
76
-
77
-
78
-
79
-
80
-
81
-
82
-
83
-
84
-
85
-
86
-
87
-
88
-
89
-
90
-
91
-
92
-
93
-
94
-
95
-
96
-
97
-
98
-
99
-
100
-
101
-
102
-
103
-
104
-
105
-
106
-
107
-
108
-
109
-
110
-
111
-
112
-
113
-
114
-
115
-
116
-
117
-
118
-
119
-
120
-
121
-
122
-
123
-
124
-
125
-
126
-
127
-
128
 |
 |

54
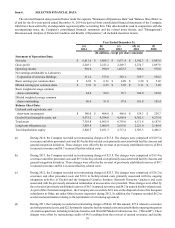
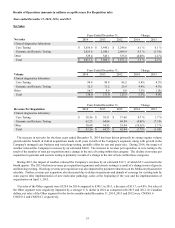
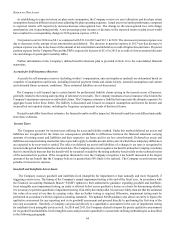
Cost of Sales Years Ended December 31, Change
2014 2013 2012 2014 2013
Cost of sales $ 3,808.5 $ 3,585.1 $ 3,421.7 6.2% 4.8%
Cost of sales as a % of sales 63.4% 61.7% 60.3%
Cost of sales (primarily laboratory and distribution costs) increased 6.2% in 2014 as compared with 2013 primarily due to
increased test volumes and test mix changes. The increase in cost of sales as a percentage of net sales in 2014 as compared to 2013
is due to the increased number of tests per requisition. The increase in cost of sales as a percentage of net sales in 2013 as compared
to 2012 is primarily due to lower revenues resulting from the Medicare fee reductions, the impact of delays and denials of coverage
of molecular pathology codes and sequestration in 2013, as mentioned above.
Labor and testing supplies for the year ended December 31, 2014, comprise over 77.4% of the Company’s cost of sales. Cost
of sales has increased over the three year period ended December 31, 2014 primarily due to overall growth in the Company's
volume (including a 2.5% increase in the number of tests per requisition), the impact of acquisitions and increases in labor.
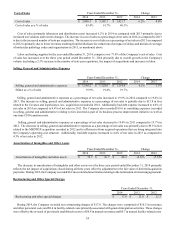
Selling, General and Administrative Expenses
Years Ended December 31, Change
2014 2013 2012 2014 2013
Selling, general and administrative expenses $ 1,198.2 $ 1,128.8 $ 1,114.6 6.1% 1.3%
SG&A as a % of sales 19.9% 19.4% 19.7%
Selling, general and administrative expenses as a percentage of net sales increased to 19.9% in 2014 compared to 19.4% in
2013. The increase in selling, general and administrative expenses as a percentage of net sales is partially due to $13.8 in fees
related to the Covance and LipoScience, Inc. acquisitions recorded in 2014. Additionally, bad debt expense increased to 4.6% of
net sales in 2014 as compared to 4.4% of net sales in 2013. The Company also recorded $18.6 in consulting expenses (recorded
in selling, general and administrative) relating to fees incurred as part of its business process improvement initiative as well as
one-time CFO transition costs.
Selling, general and administrative expenses as a percentage of net sales decreased to 19.4% in 2013 compared to 19.7% in
2012. The decrease in selling, general and administrative expenses as a percentage of net sales was primarily due to $9.9 in fees
related to the MEDTOX acquisition recorded in 2012 and to efficiencies from acquired operations that are being integrated into
the Company's operating cost structure. Additionally, bad debt expense increased to 4.4% of net sales in 2013 as compared to
4.3% of net sales in 2012.
Amortization of Intangibles and Other Assets
Years Ended December 31, Change
2014 2013 2012 2014 2013
Amortization of intangibles and other assets $ 76.7 $ 81.7 $ 86.3 (6.1)% (5.3)%
The decrease in amortization of intangibles and other assets over the three year period ended December 31, 2014 primarily
reflects the net impact of acquisitions closed during all three years offset by adjustments to the fair value of deferred acquisition
payments. During 2012, the Company recorded $6.2 in accelerated amortization relating to the termination of a licensing agreement.
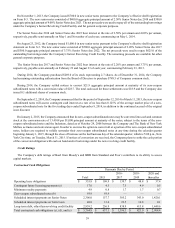
Restructuring and Other Special Charges
Years Ended December 31,
2014 2013 2012
Restructuring and other special charges $ 17.8 $ 21.8 $ 25.3
During 2014, the Company recorded net restructuring charges of $17.8. The charges were comprised of $10.5 in severance
and other personnel costs and $8.4 in facility-related costs primarily associated with general integration activities. These charges
were offset by the reversal of previously established reserves of $0.4 in unused severance and $0.7 in unused facility-related costs.