LabCorp 2015 Annual Report Download - page 101
Download and view the complete annual report
Please find page 101 of the 2015 LabCorp annual report below. You can navigate through the pages in the report by either clicking on the pages listed below, or by using the keyword search tool below to find specific information within the annual report.-
 1
1 -
2
-
3
-
4
-
5
-
6
-
7
-
8
-
9
-
10
-
11
-
12
-
13
-
14
-
15
-
16
-
17
-
18
-
19
-
20
-
21
-
22
-
23
-
24
-
25
-
26
-
27
-
28
-
29
-
30
-
31
-
32
-
33
-
34
-
35
-
36
-
37
-
38
-
39
-
40
-
41
-
42
-
43
-
44
-
45
-
46
-
47
-
48
-
49
-
50
-
51
-
52
-
53
-
54
-
55
-
56
-
57
-
58
-
59
-
60
-
61
-
62
-
63
-
64
-
65
-
66
-
67
-
68
-
69
-
70
-
71
-
72
-
73
-
74
-
75
-
76
-
77
-
78
-
79
-
80
-
81
-
82
-
83
-
84
-
85
-
86
-
87
-
88
-
89
-
90
-
 91
91 -
 92
92 -
 93
93 -
 94
94 -
 95
95 -
 96
96 -
 97
97 -
 98
98 -
 99
99 -
 100
100 -
 101
101 -
 102
102 -
 103
103 -
 104
104 -
 105
105 -
 106
106 -
 107
107 -
 108
108 -
 109
109 -
 110
110 -
 111
111 -
112
-
113
-
114
-
115
-
116
-
117
-
118
-
119
-
120
-
121
-
122
-
123
-
124
-
125
-
126
-
127
-
128
-
129
-
130
-
131
-
132
-
133
-
134
-
135
-
136
-
137
-
138
-
139
-
140
-
141
-
142
-
143
-
144
-
145
-
146
-
147
-
148
-
149
-
150
-
151
 |
 |
Index
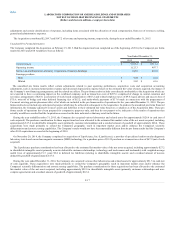
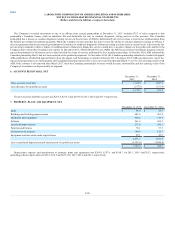
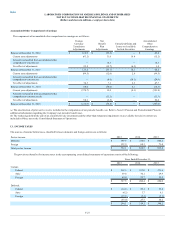
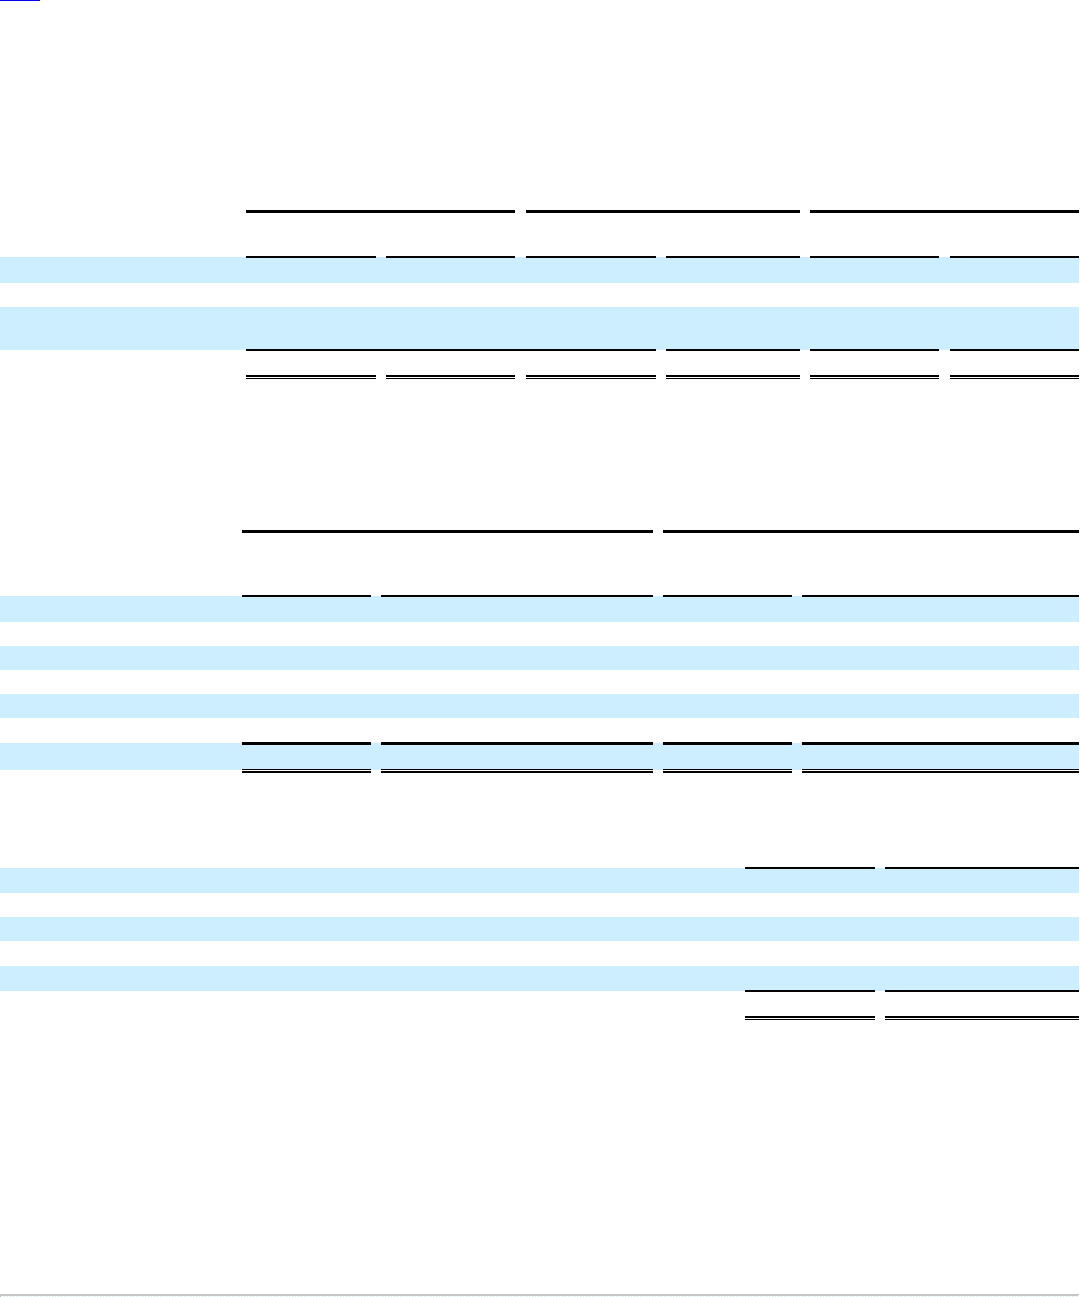
The changes in the carrying amount of goodwill (net of accumulated amortization) for the years ended December 31, 2015 and 2014 are as follows:
LCD
CDD
Total
December 31,
2015
December 31,
2014
December 31,
2015
December 31,
2014
December 31,
2015
December 31,
2014
Balance as of January 1 $ 2,988.9
$ 2,912.3
$ 110.5
$ 110.5
$ 3,099.4
$ 3,022.8
Goodwill acquired during the year 161.6
81.8
2,979.5
—
3,141.1
81.8
Foreign currency impact and other
adjustments to goodwill (12.8)
(5.2)
—
—
(12.8)
(5.2)
Balance at end of year $ 3,137.7
$ 2,988.9
$ 3,090.0
$ 110.5
$ 6,227.7
$ 3,099.4
As discussed in Footnote 2 (Business Acquisitions), the amount of the Acquisition goodwill has not yet been allocated to the underlying domestic and
foreign subsidiaries of Covance.
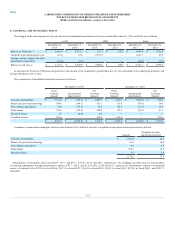
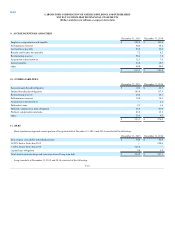
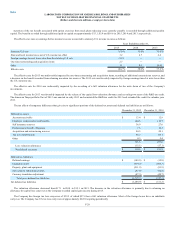
The components of identifiable intangible assets are as follows:
December 31, 2015
December 31, 2014
Gross
Carrying
Amount
Accumulated
Amortization
Net
Carrying
Amount
Gross
Carrying
Amount
Accumulated
Amortization
Net
Carrying
Amount
Customer relationships $ 3,132.4
$ (724.7)
$ 2,407.7
$ 1,361.6
$ (606.8)
$ 754.8
Patents, licenses and technology 308.0
(146.3)
161.7
125.9
(95.9)
30.0
Non-compete agreements 51.0
(37.2)
13.8
45.6
(31.7)
13.9
Trade names 399.8
(115.4)
284.4
133.3
(91.6)
41.7
Favorable leases 5.5
(0.6)
4.9
—
—
—
Canadian licenses 451.0
—
451.0
635.4
—
635.4
$ 4,347.7
$ (1,024.2)
$ 3,323.5
$ 2,301.8
$ (826.0)
$ 1,475.8
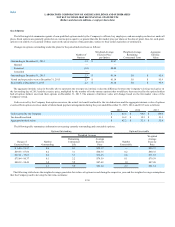
A summary of amortizable intangible assets acquired during 2015, and their respective weighted average amortization periods are as follows:
Amount
Weighted Average
Amortization Period
Customer relationships $ 1,855.0
29.2
Patents, licenses and technology 41.2
10.0
Non-compete agreements 4.3
4.9
Trade names 270.5
15.0
Favorable leases 5.5
8.0
2,176.5
27.0
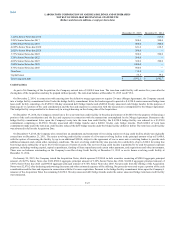
Amortization of intangible assets was $164.5, $76.7 and $81.7 in 2015, 2014 and 2013, respectively. The Company recorded earn-out and purchase
accounting adjustments through amortization expense of $1.7, $10.4, and $5.8 in 2015, 2014 and 2013, respectively. Amortization expense of intangible
assets is estimated to be $174.4 in fiscal 2016, $167.2 in fiscal 2017, $156.0 in fiscal 2018, $149.2 in fiscal 2019, $142.4 in fiscal 2020, and $2,017.3
thereafter.
F-21