LabCorp 2015 Annual Report Download - page 88
Download and view the complete annual report
Please find page 88 of the 2015 LabCorp annual report below. You can navigate through the pages in the report by either clicking on the pages listed below, or by using the keyword search tool below to find specific information within the annual report.-
 1
1 -
2
-
3
-
4
-
5
-
6
-
7
-
8
-
9
-
10
-
11
-
12
-
13
-
14
-
15
-
16
-
17
-
18
-
19
-
20
-
21
-
22
-
23
-
24
-
25
-
26
-
27
-
28
-
29
-
30
-
31
-
32
-
33
-
34
-
35
-
36
-
37
-
38
-
39
-
40
-
41
-
42
-
43
-
44
-
45
-
46
-
47
-
48
-
49
-
50
-
51
-
52
-
53
-
54
-
55
-
56
-
57
-
58
-
59
-
60
-
61
-
62
-
63
-
64
-
65
-
66
-
67
-
68
-
69
-
70
-
71
-
72
-
73
-
74
-
75
-
76
-
77
-
 78
78 -
 79
79 -
 80
80 -
 81
81 -
 82
82 -
 83
83 -
 84
84 -
 85
85 -
 86
86 -
 87
87 -
 88
88 -
 89
89 -
 90
90 -
 91
91 -
 92
92 -
 93
93 -
 94
94 -
 95
95 -
 96
96 -
 97
97 -
 98
98 -
99
-
100
-
101
-
102
-
103
-
104
-
105
-
106
-
107
-
108
-
109
-
110
-
111
-
112
-
113
-
114
-
115
-
116
-
117
-
118
-
119
-
120
-
121
-
122
-
123
-
124
-
125
-
126
-
127
-
128
-
129
-
130
-
131
-
132
-
133
-
134
-
135
-
136
-
137
-
138
-
139
-
140
-
141
-
142
-
143
-
144
-
145
-
146
-
147
-
148
-
149
-
150
-
151
 |
 |

Index
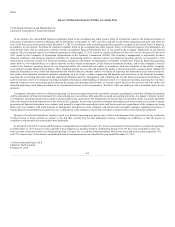
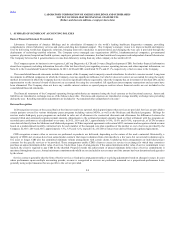
Laboratory Corporation of America Holdings and its subsidiaries (Company) is the world’s leading healthcare diagnostics company, providing
comprehensive clinical laboratory services and end-to-end drug development support. The Company’s strategic vision is to improve health and improve
lives by delivering world class diagnostic solutions, bringing innovative medicines to patients faster, and changing the way care is provided through the
deployment of technology-enabled solutions. The Company serves managed care organizations (MCOs), biopharmaceutical companies, governmental
agencies, physicians, hospitals and health systems, employers, patients and consumers, food and nutritional companies and independent clinical laboratories.
The Company believes that it generated more revenue from laboratory testing than any other company in the world in 2015.
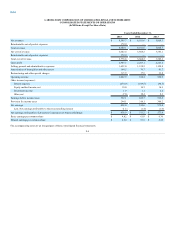
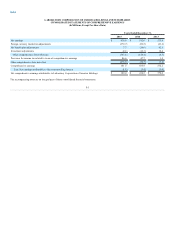
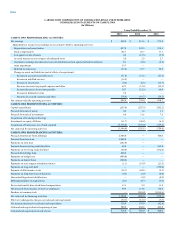
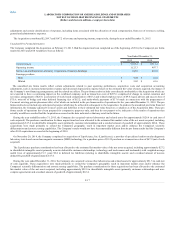
The Company reports its business in two segments, LabCorp Diagnostics (LCD) and Covance Drug Development (CDD). For further financial information
about these segments, including information for each of the last three fiscal years regarding revenue, operating income, and other important information, see
Note 20 to the Consolidated Financial Statements. In 2015, LCD and CDD contributed 72.9% and 27.1%, respectively, of net revenues to the Company.
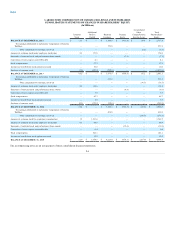
The consolidated financial statements include the accounts of the Company and its majority-owned subsidiaries for which it exercises control. Long-term
investments in affiliated companies in which the Company exercises significant influence, but which it does not control, are accounted for using the equity
method. Investments in which the Company does not exercise significant influence (generally, when the Company has an investment of less than 20% and no
representation on the investee's board of directors) are accounted for using the cost method. All significant inter-company transactions and accounts have
been eliminated. The Company does not have any variable interest entities or special purpose entities whose financial results are not included in the
consolidated financial statements.
The financial statements of the Company's operating foreign subsidiaries are measured using the local currency as the functional currency. Assets and
liabilities are translated at exchange rates as of the balance sheet date. Revenues and expenses are translated at average monthly exchange rates prevailing
during the year. Resulting translation adjustments are included in “Accumulated other comprehensive income.”
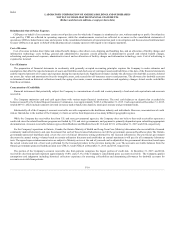
LCD recognizes revenue on the accrual basis at the time test results are reported, which approximates when services are provided. Services are provided to
certain patients covered by various third-party payer programs including various MCOs, as well as the Medicare and Medicaid programs. Billings for
services under third-party payer programs are included in sales net of allowances for contractual discounts and allowances for differences between the
amounts billed and estimated program payment amounts. Adjustments to the estimated payment amounts based on final settlement with the programs are
recorded upon settlement as an adjustment to revenue. In 2015, 2014 and 2013, approximately 16.0%, 15.0% and 16.0%, respectively, of LCD's revenues
were deriveddirectly from the Medicare and Medicaid programs. LCD has capitated agreements with certain MCO customers and recognizes related revenue
based on a predetermined monthly contractual rate for each member of the managed care plan regardless of the number or cost of services provided by the
Company. In 2015, 2014 and 2013, approximately 3.5%, 3.5% and 3.2%, respectively, of LCD's revenues were derivedfrom such capitated agreements.
CDD recognizes revenue either as services are performed or products are delivered, depending on the nature of the work contracted. Historically, a
majority of CDD’s net revenues have been earned under contracts that range in duration from a few months to a few years, but can extend in duration up to
five years or longer. CDD also has committed minimum volume arrangements with certain clients. Underlying these arrangements are individual project
contracts for the specific services to be provided. These arrangements enable CDD's clients to secure its services in exchange for which they commit to
purchase an annual minimum dollar value of services. Under these types of arrangements, if the annual minimum dollar value of service commitment is not
reached, the client is required to pay CDD for the shortfall. Progress towards the achievement of annual minimum dollar value of service commitments is
monitored throughout the year. Annual minimum commitment shortfalls are not included in net revenues until the amount has been determined and agreed to
by the client.
Service contracts generally take the form of fee-for-service or fixed-price arrangements subject to pricing adjustments based on changes in scope. In cases
where performance spans multiple accounting periods, revenue is recognized as services are performed, measured on a proportional-performance basis,
generally using output measures that are specific to the service provided.
F-8