LabCorp 2015 Annual Report Download - page 91
Download and view the complete annual report
Please find page 91 of the 2015 LabCorp annual report below. You can navigate through the pages in the report by either clicking on the pages listed below, or by using the keyword search tool below to find specific information within the annual report.-
 1
1 -
2
-
3
-
4
-
5
-
6
-
7
-
8
-
9
-
10
-
11
-
12
-
13
-
14
-
15
-
16
-
17
-
18
-
19
-
20
-
21
-
22
-
23
-
24
-
25
-
26
-
27
-
28
-
29
-
30
-
31
-
32
-
33
-
34
-
35
-
36
-
37
-
38
-
39
-
40
-
41
-
42
-
43
-
44
-
45
-
46
-
47
-
48
-
49
-
50
-
51
-
52
-
53
-
54
-
55
-
56
-
57
-
58
-
59
-
60
-
61
-
62
-
63
-
64
-
65
-
66
-
67
-
68
-
69
-
70
-
71
-
72
-
73
-
74
-
75
-
76
-
77
-
78
-
79
-
80
-
 81
81 -
 82
82 -
 83
83 -
 84
84 -
 85
85 -
 86
86 -
 87
87 -
 88
88 -
 89
89 -
 90
90 -
 91
91 -
 92
92 -
 93
93 -
 94
94 -
 95
95 -
 96
96 -
 97
97 -
 98
98 -
 99
99 -
 100
100 -
 101
101 -
102
-
103
-
104
-
105
-
106
-
107
-
108
-
109
-
110
-
111
-
112
-
113
-
114
-
115
-
116
-
117
-
118
-
119
-
120
-
121
-
122
-
123
-
124
-
125
-
126
-
127
-
128
-
129
-
130
-
131
-
132
-
133
-
134
-
135
-
136
-
137
-
138
-
139
-
140
-
141
-
142
-
143
-
144
-
145
-
146
-
147
-
148
-
149
-
150
-
151
 |
 |

Index
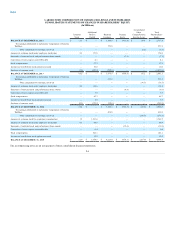
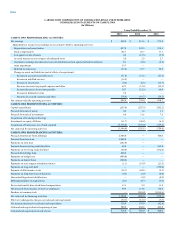
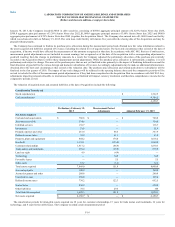
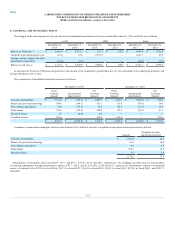
Basic earnings per share is computed by dividing net earnings attributable to Laboratory Corporation of America Holdings by the weighted average
number of common shares outstanding. Diluted earnings per share is computed by dividing net earnings including the impact of dilutive adjustments by the
weighted average number of common shares outstanding plus potentially dilutive shares, as if they had been issued at the earlier of the date of issuance or the
beginning of the period presented. Potentially dilutive common shares result primarily from the Company’s outstanding stock options, restricted stock
awards, performance share awards, and shares issuable upon conversion of zero-coupon subordinated notes.
The following represents a reconciliation of basic earnings per share to diluted earnings per share:
2015
2014
2013
Income
Shares
Per Share
Amount
Income
Shares
Per Share
Amount
Income
Shares
Per Share
Amount
Basic earnings per share $ 436.9
98.8
$ 4.42
$ 511.2
84.8
$ 6.03
$ 573.8
90.2
$ 6.36
Stock options —
1.2
—
1.1
—
1.1
Restricted stock awards and other —
—
—
—
—
—
Effect of convertible debt, net of tax —
0.6
—
0.5
—
0.5
Diluted earnings per share $ 436.9
100.6
$ 4.34
$ 511.2
86.4
$ 5.91
$ 573.8
91.8
$ 6.25
The following table summarizes the potential common shares not included in the computation of diluted earnings per share because their impact would
have been antidilutive:
Years Ended December 31,
2015
2014
2013
Stock options —
—
0.1
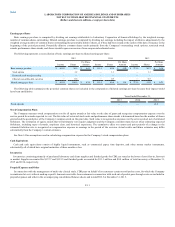
The Company measures stock compensation cost for all equity awards at fair value on the date of grant and recognizes compensation expense over the
service period for awards expected to vest. The fair value of restricted stock units and performance share awards is determined based on the number of shares
granted and the quoted price of the Company’s common stock on the grant date. Such value is recognized as expense over the service period, net of estimated
forfeitures. The estimation of equity awards that will ultimately vest requires judgment and the Company considers many factors when estimating expected
forfeitures, including types of awards, employee class, and historical experience. The cumulative effect on current and prior periods of a change in the
estimated forfeiture rate is recognized as compensation expense in earnings in the period of the revision. Actual results and future estimates may differ
substantially from the Company’s current estimates.
See Note 14 for assumptions used in calculating compensation expense for the Company’s stock compensation plans.
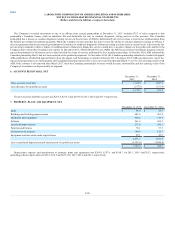
Cash and cash equivalents consist of highly liquid instruments, such as commercial paper, time deposits, and other money market instruments,
substantially all of which have original maturities of three months or less.
Inventories, consisting primarily of purchased laboratory and client supplies and finished goods for CDD, are stated at the lower of cost (first-in, first-out)
or market. Supplies accounted for $157.7 and $139.5 and finished goods accounted for $33.3 million and $0.0 million of total inventory at December 31,
2015 and 2014, respectively.
In connection with the management of multi-site clinical trials, CDD pays on behalf of its customers certain out-of-pocket costs, for which the Company
is reimbursed at cost, without markup or profit. Amounts receivable from customers in connection with such out-of-pocket pass-through costs are included in
prepaid expenses and other in the accompanying consolidated balance sheets and totaled $92.5 at December 31, 2015.
F-11