LabCorp 2015 Annual Report Download - page 119
Download and view the complete annual report
Please find page 119 of the 2015 LabCorp annual report below. You can navigate through the pages in the report by either clicking on the pages listed below, or by using the keyword search tool below to find specific information within the annual report.-
 1
1 -
2
-
3
-
4
-
5
-
6
-
7
-
8
-
9
-
10
-
11
-
12
-
13
-
14
-
15
-
16
-
17
-
18
-
19
-
20
-
21
-
22
-
23
-
24
-
25
-
26
-
27
-
28
-
29
-
30
-
31
-
32
-
33
-
34
-
35
-
36
-
37
-
38
-
39
-
40
-
41
-
42
-
43
-
44
-
45
-
46
-
47
-
48
-
49
-
50
-
51
-
52
-
53
-
54
-
55
-
56
-
57
-
58
-
59
-
60
-
61
-
62
-
63
-
64
-
65
-
66
-
67
-
68
-
69
-
70
-
71
-
72
-
73
-
74
-
75
-
76
-
77
-
78
-
79
-
80
-
81
-
82
-
83
-
84
-
85
-
86
-
87
-
88
-
89
-
90
-
91
-
92
-
93
-
94
-
95
-
96
-
97
-
98
-
99
-
100
-
101
-
102
-
103
-
104
-
105
-
106
-
107
-
108
-
 109
109 -
 110
110 -
 111
111 -
 112
112 -
 113
113 -
 114
114 -
 115
115 -
 116
116 -
 117
117 -
 118
118 -
 119
119 -
 120
120 -
 121
121 -
 122
122 -
 123
123 -
 124
124 -
 125
125 -
 126
126 -
 127
127 -
 128
128 -
 129
129 -
130
-
131
-
132
-
133
-
134
-
135
-
136
-
137
-
138
-
139
-
140
-
141
-
142
-
143
-
144
-
145
-
146
-
147
-
148
-
149
-
150
-
151
 |
 |

Index
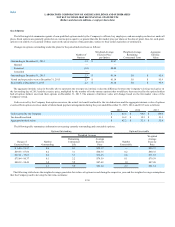
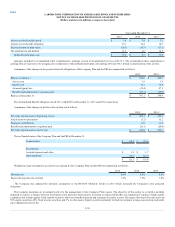
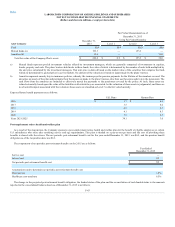
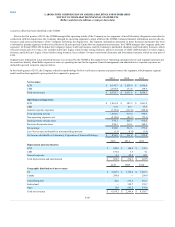
U.S. and to a lesser extent international equities in developed and emerging countries. Fixed income securities primarily include U.S. Treasury securities,
mortgage-backed bonds and corporate bonds of companies from diversified industries. Other assets include investments in commodities. The weighted
average expected long-term rate of return for the Company Plan’s assets is as follows:
Target
Allocation
Weighted Average
Expected Long-Term
Rate of Return
Equity securities 50.0%
5.5%
Fixed income securities 45.0%
1.2%
Other assets 5.0%
0.3%
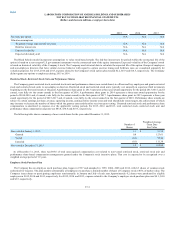
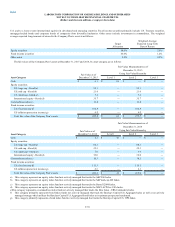
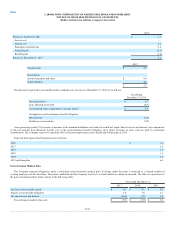
The fair values of the Company Plan’s assets at December 31, 2015 and 2014, by asset category are as follows:
Fair Value Measurements as of
December 31, 2015
Fair Value as of
December 31, 2015
Using Fair Value Hierarchy
Level 1
Level 2
Level 3
Cash $ 6.1
$ 6.1
$ —
$ —
Equity securities:
U.S. large cap - blend (a) 55.1
—
55.1
—
U.S. mid cap - blend (b) 21.0
—
21.0
—
U.S. small cap - blend (c) 7.1
—
7.1
—
International equity - blend (d) 35.7
—
35.7
—
Commodities index (e) 11.8
—
11.8
—
Fixed income securities:
U.S. fixed income (f) 102.8
—
102.8
—
U.S inflation protection income (g) 6.2
—
6.2
—
Total fair value of the Company Plan’s assets $ 245.8
$ 6.1
$ 239.7
$ —
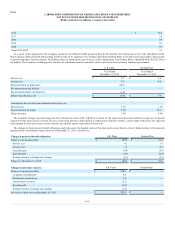
Fair Value Measurements as of
December 31, 2014
Fair Value as of
December 31, 2014
Using Fair Value Hierarchy
Level 1
Level 2
Level 3
Cash $ 4.1
$ 4.1
$ —
$ —
Equity securities:
U.S. large cap - blend (a) 64.1
—
64.1
—
U.S. mid cap - blend (b) 25.3
—
25.3
—
U.S. small cap - blend (c) 7.9
—
7.9
—
International equity - blend (d) 36.0
—
36.0
—
Commodities index (e) 10.3
—
10.3
—
Fixed income securities:
U.S. fixed income (f) 115.1
—
115.1
—
U.S inflation protection income (g) 6.3
—
6.3
—
Total fair value of the Company Plan’s assets $ 269.1
$ 4.1
$ 265.0
$ —
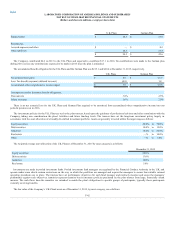
a) This category represents an equity index fund not actively managed that tracks the S&P 500 Index.
b) This category represents an equity index fund not actively managed that tracks the S&P mid-cap 400 Index.
c) This category represents an equity index fund not actively managed that tracks the Russell 2000 Index.
d) This category represents an equity index fund not actively managed that tracks the MSCI ACWI ex USA Index.
e)This category represents a commodities index fund not actively managed that tracks the Dow Jones - UBS Commodity Index.
f) This category primarily represents bond index funds not actively managed that track the Barclays Capital U.S. Aggregate Index as well as an actively
managed strategy which utilizes the Barclays Capital U.S. Aggregate Bond Index as its primary prospectus benchmark.
g) This category primarily represents a bond index fund not actively managed that tracks the Barclays Capital U.S. TIPS Index.
F-39