LabCorp 2015 Annual Report Download - page 53
Download and view the complete annual report
Please find page 53 of the 2015 LabCorp annual report below. You can navigate through the pages in the report by either clicking on the pages listed below, or by using the keyword search tool below to find specific information within the annual report.-
 1
1 -
2
-
3
-
4
-
5
-
6
-
7
-
8
-
9
-
10
-
11
-
12
-
13
-
14
-
15
-
16
-
17
-
18
-
19
-
20
-
21
-
22
-
23
-
24
-
25
-
26
-
27
-
28
-
29
-
30
-
31
-
32
-
33
-
34
-
35
-
36
-
37
-
38
-
39
-
40
-
41
-
42
-
 43
43 -
 44
44 -
 45
45 -
 46
46 -
 47
47 -
 48
48 -
 49
49 -
 50
50 -
 51
51 -
 52
52 -
 53
53 -
 54
54 -
 55
55 -
 56
56 -
 57
57 -
 58
58 -
 59
59 -
 60
60 -
 61
61 -
 62
62 -
 63
63 -
64
-
65
-
66
-
67
-
68
-
69
-
70
-
71
-
72
-
73
-
74
-
75
-
76
-
77
-
78
-
79
-
80
-
81
-
82
-
83
-
84
-
85
-
86
-
87
-
88
-
89
-
90
-
91
-
92
-
93
-
94
-
95
-
96
-
97
-
98
-
99
-
100
-
101
-
102
-
103
-
104
-
105
-
106
-
107
-
108
-
109
-
110
-
111
-
112
-
113
-
114
-
115
-
116
-
117
-
118
-
119
-
120
-
121
-
122
-
123
-
124
-
125
-
126
-
127
-
128
-
129
-
130
-
131
-
132
-
133
-
134
-
135
-
136
-
137
-
138
-
139
-
140
-
141
-
142
-
143
-
144
-
145
-
146
-
147
-
148
-
149
-
150
-
151
 |
 |

Index
The effective rate for 2015 was unfavorably impacted by one-time restructuring and acquisition items, recording of additional uncertain tax reserves, and
a decrease in the benefit recorded from releasing uncertain tax reserves. The 2015 rate was favorably impacted by CDD foreign earnings taxed at rates lower
than the U.S. statutory rate.
The effective rate for 2014 was unfavorably impacted by the recording of a full valuation allowance for the write-down of two of the Company's
investments.
The effective rate for 2013 was favorably impacted by the release of a capital loss valuation allowance and recording two years of a R&D tax credit. The
American Taxpayer Relief Act of 2012 was enacted in early 2013 and reinstated the R&D tax credit for 2012 and extended the credit for calendar year 2013.
The Company's strong cash-generating capability and financial condition typically have provided ready access to capital markets. The Company's
principal source of liquidity is operating cash flow, supplemented by proceeds from debt offerings. The Company's senior unsecured revolving credit facility
is further discussed in Note 11 (Debt) to the Company's Consolidated Financial Statements.
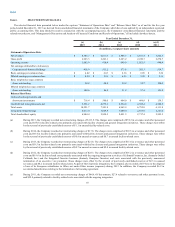
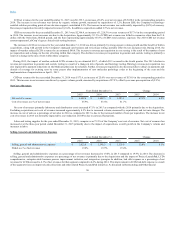
In summary the Company's cash flows were as follows:
For the Year Ended December 31,
2015
2014
2013
Net cash provided by operating activities $ 982.4
$ 739.0
$ 818.7
Net cash used for investing activities (3,994.9)
(350.1)
(359.6)
Net cash provided by (used in) financing activities 3,184.6
(200.6)
(518.3)
Effect of exchange rate on changes in cash and cash equivalents (35.7)
(12.3)
(3.6)
Net change in cash and cash equivalents $ 136.4
$ 176.0
$ (62.8)
Cash and cash equivalents at December 31, 2015, 2014 and 2013 totaled $716.4, $580.0, and $404.0, respectively. Cash and cash equivalents consist of
highly liquid instruments, such as commercial paper, time deposits and other money market investments, substantially all of which have original maturities
of three months or less.
Net cash provided by operating activities for the year ended December 31, 2015 was $982.4 compared to $739.0 for the year ended December 31, 2014.
The increase in cash provided by operations was due primarily to additional cash generated by CDD operations following the Acquisition as well as
improved working capital. While there were lower net earnings due to the Acquisition, this included a number of one-time non-cash charges. The Company’s
earnings were impacted by restructuring and special items of $113.9 during 2015, compared to $17.8 during the same period in 2014. During the first quarter
of 2015, the Company's operating cash flows were reduced by $153.5 of cash payments in connection with the Acquisition.
Net cash provided by operating activities for the year ended December 31, 2014 was $739.0 compared to $818.7 for the year ended December 31, 2013.
The decrease in cash flows from operating activities for the year ended December 31, 2014, as compared to the prior year, was primarily attributable to $62.8
lower net earnings. The Company’s lower net earnings were driven by a 2% decline in its operating margins due to changes in payer and test mix as well as
increased acquisition and consulting costs. The Company’s cash collections improved by $36.4 compared to the prior year, representing improvements in
collections efforts on the delays and denials of payments the Company experienced in 2013 as a result of new molecular pathology codes and government
payment reductions. However, this improvement was overshadowed by an $82.0 million increase in the use of cash from accounts payable disbursements.
During 2014, the Company’s interest payments increased $20.6 compared to 2013, reflecting the timing of interest payments on the $700.0 in new senior
notes issued in November 2013. This was partially offset by a $17.4 decrease in net taxes paid during the year compared to 2013. In addition, the net impact
of changes in noncash adjustments, primarily related to deferred taxes, depreciation and amortization, stock compensation and gain/loss on sale of assets
contributed to the $79.7 decrease in operating cash flows for 2014 as compared to the prior year.
Net cash used in investing activities for the year ended December 31, 2015 was $3,994.9 as compared to $350.1 for the year ended December 31, 2014.
The $3,644.8 increase in cash used in investing activities was primarily due to net cash paid for the
53