LabCorp 2015 Annual Report Download - page 49
Download and view the complete annual report
Please find page 49 of the 2015 LabCorp annual report below. You can navigate through the pages in the report by either clicking on the pages listed below, or by using the keyword search tool below to find specific information within the annual report.-
 1
1 -
2
-
3
-
4
-
5
-
6
-
7
-
8
-
9
-
10
-
11
-
12
-
13
-
14
-
15
-
16
-
17
-
18
-
19
-
20
-
21
-
22
-
23
-
24
-
25
-
26
-
27
-
28
-
29
-
30
-
31
-
32
-
33
-
34
-
35
-
36
-
37
-
38
-
 39
39 -
 40
40 -
 41
41 -
 42
42 -
 43
43 -
 44
44 -
 45
45 -
 46
46 -
 47
47 -
 48
48 -
 49
49 -
 50
50 -
 51
51 -
 52
52 -
 53
53 -
 54
54 -
 55
55 -
 56
56 -
 57
57 -
 58
58 -
 59
59 -
60
-
61
-
62
-
63
-
64
-
65
-
66
-
67
-
68
-
69
-
70
-
71
-
72
-
73
-
74
-
75
-
76
-
77
-
78
-
79
-
80
-
81
-
82
-
83
-
84
-
85
-
86
-
87
-
88
-
89
-
90
-
91
-
92
-
93
-
94
-
95
-
96
-
97
-
98
-
99
-
100
-
101
-
102
-
103
-
104
-
105
-
106
-
107
-
108
-
109
-
110
-
111
-
112
-
113
-
114
-
115
-
116
-
117
-
118
-
119
-
120
-
121
-
122
-
123
-
124
-
125
-
126
-
127
-
128
-
129
-
130
-
131
-
132
-
133
-
134
-
135
-
136
-
137
-
138
-
139
-
140
-
141
-
142
-
143
-
144
-
145
-
146
-
147
-
148
-
149
-
150
-
151
 |
 |
Index
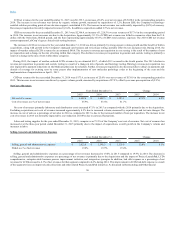
On February 19, 2015 (Acquisition Date), the Company completed its acquisition (Acquisition) of Covance Inc. (Covance), a leading drug development
services company and a leader in nutritional analysis, for $6,150.7. The Acquisition contributed $2,209.7 to the Company's total net revenue from the
Acquisition Date driving 36.7% year over year net growth. The Company expects the inclusion of Covance for a full twelve months in 2016 will provide an
approximate 4.0% increase in revenue based upon Covance's pre-acquisition 2015 net revenues. Organic revenue growth in 2015, excluding currency, was
4.6%.
The Company achieved $45.0 in synergies in 2015 as a result of the Acquisition and expects annual cost synergies in excess of $100.0 to be fully realized
within three years of closing the transaction. The Company's 2015 results were impacted by increased interest expense and historically lower margins from
Covance. The Company is committed to maintaining its investment grade credit rating and plans to use its operating cash flows to meet its annual capital
expenditure requirements and to reduce its overall debt leverage, while evaluating other strategic opportunities for deployment of its capital.
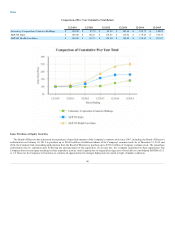
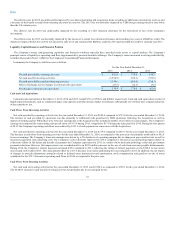
The Company has seen growth in the amount of its patient accounts receivable. A significant portion of the Company’s bad debt expense is related to
LCD accounts receivable from patients. The Company believes its current allowance for doubtful accounts is sufficient to properly record its accounts
receivable at their estimated net realizable value. Should the shift towards increased patient responsibility continue, the Company may need to increase its
allowance for doubtful accounts and bad debt expense in future periods.
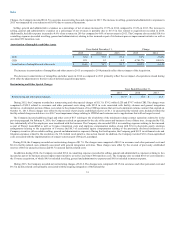
Prior to the first quarter of 2015, the chief operating decision maker (CODM) managed the operating results of the Company as two segments: clinical
laboratory diagnostics and other. In connection with the Acquisition, the Company changed its operating segments to align with how the CODM evaluates
financial information used to allocate resources and assess performance of the Company following the Acquisition. The segment information presented in the
Company's consolidated financial statements has been conformed to present segments on this revised basis for all prior periods. Under the new organizational
structure, the CODM manages the Company under two reportable segments: LabCorp Diagnostics (LCD) and Covance Drug Development (CDD). LCD
includes the Company's legacy LabCorp business, and the Company's nutritional chemistry and food safety business, which were previously part of Covance,
but excludes LabCorp’s legacy clinical trials testing business, which is now part of CDD. CDD includes the Covance legacy business, and LabCorp’s legacy
clinical trials testing business, but excludes Covance's nutritional chemistry and food safety business, which are now part of LCD.
The Company experiences seasonality in both segments of its business. The majority of LCD's testing volume is dependent on patient visits to physician
offices and other providers of healthcare. Testing volume in both segments generally declines during the year-end holiday periods and other major holidays.
In addition, testing volume also declines due to inclement weather which may reduce net revenues and cash flows. CDD's operations are also impacted by
changes in the global economy, exchange rate fluctuations, the progress of ongoing studies and the start-up of new studies, as well as the level of
expenditures made by the pharmaceutical and biotechnology industries in research and development (R&D). Given the seasonality of the business,
comparison of the results for successive quarters may not accurately reflect trends or results for the full year.
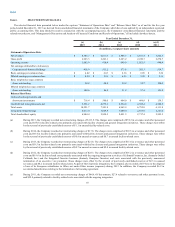
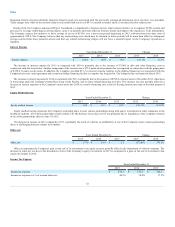
Years Ended December 31,
Change
2015
2014
2013
2015
2014
LCD $ 6,199.3
$ 5,838.0
$ 5,669.4
6.2%
3.0%
CDD 2,306.4
173.6
138.9
1,228.5%
25.0%
Total $ 8,505.7
$ 6,011.6
$ 5,808.3
41.5%
3.5%
The increase in net revenues for the year ended December 31, 2015 was driven primarily by the Acquisition along with strong organic volume growth in
LCD and tuck-in acquisitions, price, and mix, partially offset by currency.
49