LabCorp 2015 Annual Report Download - page 128
Download and view the complete annual report
Please find page 128 of the 2015 LabCorp annual report below. You can navigate through the pages in the report by either clicking on the pages listed below, or by using the keyword search tool below to find specific information within the annual report.-
 1
1 -
2
-
3
-
4
-
5
-
6
-
7
-
8
-
9
-
10
-
11
-
12
-
13
-
14
-
15
-
16
-
17
-
18
-
19
-
20
-
21
-
22
-
23
-
24
-
25
-
26
-
27
-
28
-
29
-
30
-
31
-
32
-
33
-
34
-
35
-
36
-
37
-
38
-
39
-
40
-
41
-
42
-
43
-
44
-
45
-
46
-
47
-
48
-
49
-
50
-
51
-
52
-
53
-
54
-
55
-
56
-
57
-
58
-
59
-
60
-
61
-
62
-
63
-
64
-
65
-
66
-
67
-
68
-
69
-
70
-
71
-
72
-
73
-
74
-
75
-
76
-
77
-
78
-
79
-
80
-
81
-
82
-
83
-
84
-
85
-
86
-
87
-
88
-
89
-
90
-
91
-
92
-
93
-
94
-
95
-
96
-
97
-
98
-
99
-
100
-
101
-
102
-
103
-
104
-
105
-
106
-
107
-
108
-
109
-
110
-
111
-
112
-
113
-
114
-
115
-
116
-
117
-
 118
118 -
 119
119 -
 120
120 -
 121
121 -
 122
122 -
 123
123 -
 124
124 -
 125
125 -
 126
126 -
 127
127 -
 128
128 -
 129
129 -
 130
130 -
 131
131 -
 132
132 -
 133
133 -
 134
134 -
 135
135 -
 136
136 -
 137
137 -
 138
138 -
139
-
140
-
141
-
142
-
143
-
144
-
145
-
146
-
147
-
148
-
149
-
150
-
151
 |
 |

Index
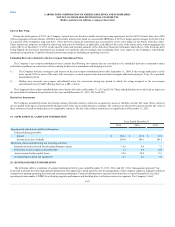
executive officer has been identified as the CODM.
Prior to the first quarter of 2015, the CODM managed the operating results of the Company as two segments: clinical laboratory diagnostics and other. In
connection with the Acquisition, the Company changed its operating segments to align with how the CODM evaluates financial information used to allocate
resources and assess performance of the Company following the Acquisition. The segment information presented in these financial statements has been
conformed to present segments on this revised basis for all prior periods. Under the new organizational structure, the CODM manages the Company under two
segments: LCD and CDD. LCD includes the Company's legacy LabCorp business, and the Company's nutritional chemistry and food safety business, which
were previously part of Covance, but excludes LabCorp’s legacy clinical trials testing business, which is now part of CDD. CDD includes Covance's legacy
business, and LabCorp’s legacy clinical trials testing business, but excludes Covance's nutritional chemistry and food safety business, which are now part of
LCD.
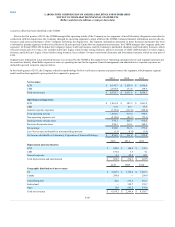
Segment asset information is not presented because it is not used by the CODM at the segment level. Operating earnings (loss) of each segment represents net
revenues less directly identifiable expenses to arrive at operating income for the segment. General management and administrative corporate expenses are
included in general corporate expenses below.
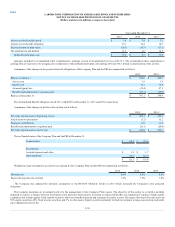
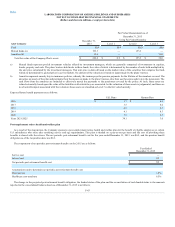
In the fourth quarter of 2015, the Company refined its methodology for how it allocates corporate expenses between the segments, which impacts segment
results and has been applied to prior periods for comparative purposes.
2015
2014
2013
LCD
$ 6,199.3
$ 5,838.0
$ 5,669.4
CDD
2,306.4
173.6
138.9
Total net revenues
$ 8,505.7
$ 6,011.6
$ 5,808.3
LCD
$ 1,061.4
$ 982.3
$ 1,061.8
CDD
71.9
40.7
37.9
General corporate expenses
(130.4)
(112.6)
(108.8)
Total operating income
1,002.9
910.4
990.9
Non-operating expenses, net
(270.8)
(83.7)
(75.3)
Earnings before income taxes
732.1
826.7
915.6
Provision for income taxes
294.1
314.1
340.2
Net earnings
438.0
512.6
575.4
Less: Net income attributable to noncontrolling interests
(1.1)
(1.4)
(1.6)
Net income attributable to Laboratory Corporation of America Holdings
$ 436.9
$ 511.2
$ 573.8
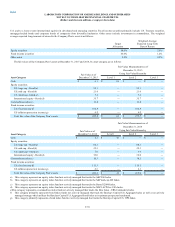
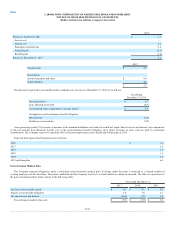
2015
2014
2013
LCD
$ 245.8
$ 184.8
$ 176.3
CDD
184.4
5.3
4.1
General corporate
4.1
44.2
42.1
Total depreciation and amortization
$ 434.3
$ 234.3
$ 222.5
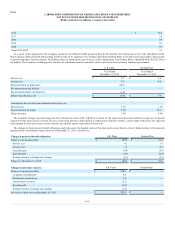
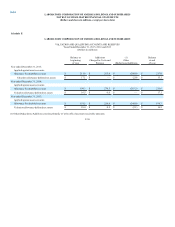
LCD
CDD
Total
US
$ 5,847.3
$ 1,156.0
$ 7,003.3
Canada
290.4
—
290.4
United Kingdom
46.2
235.5
281.7
Switzerland
—
359.7
359.7
Other
15.4
555.2
570.6
Total net revenues
$ 6,199.3
$ 2,306.4
$ 8,505.7
F-48