LabCorp 2015 Annual Report Download - page 50
Download and view the complete annual report
Please find page 50 of the 2015 LabCorp annual report below. You can navigate through the pages in the report by either clicking on the pages listed below, or by using the keyword search tool below to find specific information within the annual report.-
 1
1 -
2
-
3
-
4
-
5
-
6
-
7
-
8
-
9
-
10
-
11
-
12
-
13
-
14
-
15
-
16
-
17
-
18
-
19
-
20
-
21
-
22
-
23
-
24
-
25
-
26
-
27
-
28
-
29
-
30
-
31
-
32
-
33
-
34
-
35
-
36
-
37
-
38
-
39
-
 40
40 -
 41
41 -
 42
42 -
 43
43 -
 44
44 -
 45
45 -
 46
46 -
 47
47 -
 48
48 -
 49
49 -
 50
50 -
 51
51 -
 52
52 -
 53
53 -
 54
54 -
 55
55 -
 56
56 -
 57
57 -
 58
58 -
 59
59 -
 60
60 -
61
-
62
-
63
-
64
-
65
-
66
-
67
-
68
-
69
-
70
-
71
-
72
-
73
-
74
-
75
-
76
-
77
-
78
-
79
-
80
-
81
-
82
-
83
-
84
-
85
-
86
-
87
-
88
-
89
-
90
-
91
-
92
-
93
-
94
-
95
-
96
-
97
-
98
-
99
-
100
-
101
-
102
-
103
-
104
-
105
-
106
-
107
-
108
-
109
-
110
-
111
-
112
-
113
-
114
-
115
-
116
-
117
-
118
-
119
-
120
-
121
-
122
-
123
-
124
-
125
-
126
-
127
-
128
-
129
-
130
-
131
-
132
-
133
-
134
-
135
-
136
-
137
-
138
-
139
-
140
-
141
-
142
-
143
-
144
-
145
-
146
-
147
-
148
-
149
-
150
-
151
 |
 |

Index
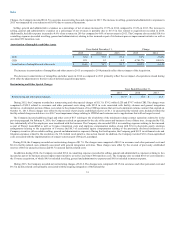
LCD net revenues for the year ended December 31, 2015 were $6,199.3, an increase of 6.2% over net revenues of $5,838.0 in the corresponding period in
2014. The increase in net revenues was driven by organic volume growth, measured by requisitions of 3.2%. Beacon LBS, the Company's technology-
enabled solution providing point-of-care decision support, contributed 0.9%. The increase in net revenues was unfavorably impacted by (0.8%) of currency.
Revenue per requisition favorably impacted revenue by 0.4%. In addition, acquisitions added 2.5% to net revenues.
CDD net revenues for the year ended December 31, 2015 were $2,306.4, an increase of 1,228.5% over net revenues of $173.6 in the corresponding period
in 2014. The increase in net revenues was due to the Acquisition. Approximately 52.1% of CDD's net revenues are billed in currencies other than the U.S.
dollar, with the Swiss franc, British pound, and the Euro representing approximately 66.8% of CDD's total currency exposure. The 2014 CDD net revenue
amount represents LabCorp’s legacy clinical trials testing business.
The increase in LCD net revenues for the year ended December 31, 2014 was driven primarily by strong organic volume growth and the benefit of fold-in
acquisitions, along with growth in the Company's managed care business and toxicology testing, partially offset by test and payer mix. During 2014, the
impact of weather reduced LCD's revenues by an estimated $40.0. The increase in revenue per requisition in core testing is the result of the number of tests
per requisition and a change in the mix of testing within that category. The decline in revenue per requisition in genomic and esoteric testing is primarily a
result of a change in the mix of tests within those categories.
During 2013, the impact of weather, reduced LCD's revenues by an estimated $12.7, of which $5.3 occurred in the fourth quarter. The 2013 decline in
revenue per requisition in genomic and esoteric testing is a result of a change in mix of genetic and histology testing. Histology revenue per requisition was
also impacted by payment reductions on the Medicare physician fee schedule. Further, revenue per requisition also decreased due to delays in payments and
denials of coverage for existing tests by some payers after implementation of new molecular pathology codes at the beginning of the year and the
implementation of sequestration on April 1, 2013.
CDD net revenues for the year ended December 31, 2014 were $173.6, an increase of 25.0% over net revenues of $138.9 in the corresponding period in
2013. This increase in net revenues was driven by organic volume growth, measured by requisitions of 27.9%, offset by revenue per requisition of (2.9%).
Years Ended December 31,
Change
2015
2014
2013
2015
2014
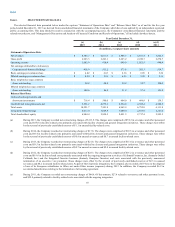
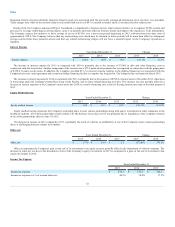
Net cost of revenues $ 5,602.4
$ 3,808.5
$ 3,585.1
47.1%
6.2%
Cost of revenues as a % of net revenues 65.9%
63.4%
61.7%
Net cost of revenues (primarily laboratory and distribution costs) increased 47.1% in 2015 as compared with the 2014 primarily due to the Acquisition.
Excluding acquisitions, net costs of revenues increased approximately 4.2% due to increased volume, measured by requisitions, and test mix changes. The
increase in cost of sales as a percentage of net sales in 2014 as compared to 2013 is due to the increased number of tests per requisition. The increase in net
cost of revenues in 2015 was favorably impacted by a net reduction of (0.8%) due to currency fluctuations.
Labor and testing supplies for the year ended December 31, 2015, comprise over 75.5% of the Company’s net cost of revenues. Net cost of revenues has
increased over the three-year period ended December 31, 2015 primarily due to the impact of acquisitions, overall growth in the Company's volume and
increases in labor.
Years Ended December 31,
Change
2015
2014
2013
2015
2014
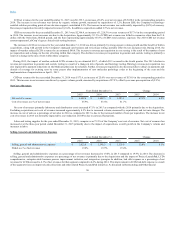
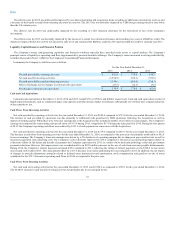
Selling, general and administrative expenses $ 1,622.0
$ 1,198.2
$ 1,128.8
35.4%
6.1%
SG&A as a % of net revenues 19.0%
19.9%
19.4%
Selling, general and administrative expenses as a percentage of net revenues decreased to 19.0% in 2015 compared to 19.9% in 2014. The decrease in
selling, general and administrative expenses as a percentage of net revenues is primarily due to the Acquisitio n and the impact of Project LaunchPad, LCD's
comprehensive, enterprise-wide business process improvement initiative, and integration synergies. In addition, bad debt expense as a percentage of net
revenues for LCD decreased to 4.3% of net revenues for that segment compared to 4.6% during 2014. This improvement in LCD's bad debt expense is a result
of the segment's focus on improved cash collections and other related Project LaunchPad initiatives. As discussed in Restructuring and Other Special
50