LabCorp 2015 Annual Report Download - page 106
Download and view the complete annual report
Please find page 106 of the 2015 LabCorp annual report below. You can navigate through the pages in the report by either clicking on the pages listed below, or by using the keyword search tool below to find specific information within the annual report.-
 1
1 -
2
-
3
-
4
-
5
-
6
-
7
-
8
-
9
-
10
-
11
-
12
-
13
-
14
-
15
-
16
-
17
-
18
-
19
-
20
-
21
-
22
-
23
-
24
-
25
-
26
-
27
-
28
-
29
-
30
-
31
-
32
-
33
-
34
-
35
-
36
-
37
-
38
-
39
-
40
-
41
-
42
-
43
-
44
-
45
-
46
-
47
-
48
-
49
-
50
-
51
-
52
-
53
-
54
-
55
-
56
-
57
-
58
-
59
-
60
-
61
-
62
-
63
-
64
-
65
-
66
-
67
-
68
-
69
-
70
-
71
-
72
-
73
-
74
-
75
-
76
-
77
-
78
-
79
-
80
-
81
-
82
-
83
-
84
-
85
-
86
-
87
-
88
-
89
-
90
-
91
-
92
-
93
-
94
-
95
-
 96
96 -
 97
97 -
 98
98 -
 99
99 -
 100
100 -
 101
101 -
 102
102 -
 103
103 -
 104
104 -
 105
105 -
 106
106 -
 107
107 -
 108
108 -
 109
109 -
 110
110 -
 111
111 -
 112
112 -
 113
113 -
 114
114 -
 115
115 -
 116
116 -
117
-
118
-
119
-
120
-
121
-
122
-
123
-
124
-
125
-
126
-
127
-
128
-
129
-
130
-
131
-
132
-
133
-
134
-
135
-
136
-
137
-
138
-
139
-
140
-
141
-
142
-
143
-
144
-
145
-
146
-
147
-
148
-
149
-
150
-
151
 |
 |
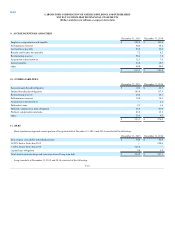
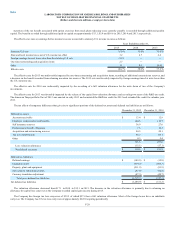
Index
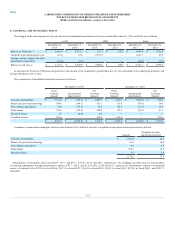
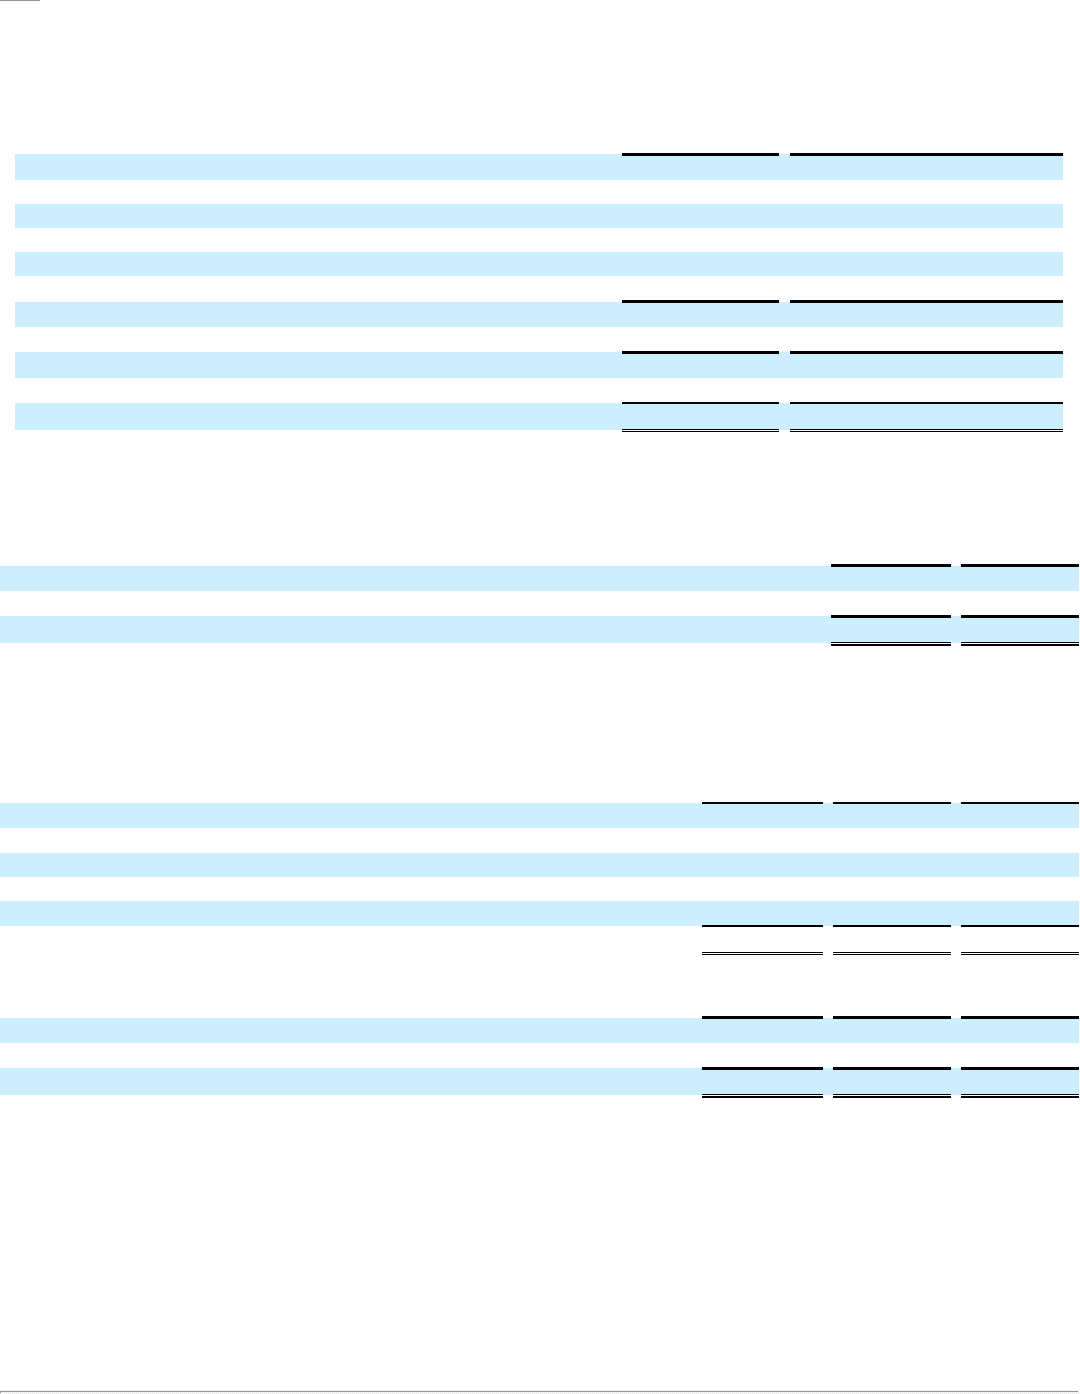
Notes and Other
Capital Leases
Total
2016 $ 419.5
$ 11.9
$ 431.4
2017 500.0
11.9
511.9
2018 443.8
11.7
455.5
2019 64.6
11.2
75.8
2020 1,728.2
10.6
1,738.8
Thereafter 3,200.0
47.2
3,247.2
6,356.1
104.5
6,460.6
Less amounts representing interest —
(43.6)
(43.6)
Total long-term debt 6,356.1
60.9
6,417
Less current portion (419.5)
(5.4)
(424.9)
Long-term debt, due beyond one year $ 5,936.6
$ 55.5
$ 5,992.1
The Company is authorized to issue up to 265.0 shares of common stock, par value $0.10 per share. The Company’s treasury shares are recorded at
aggregate cost. Common shares issued and outstanding are summarized in the following table:
2015
2014
Issued 123.9
107.1
In treasury (22.6)
(22.5)
Outstanding 101.3
84.6
The Company is authorized to issue up to 30.0 shares of preferred stock, par value $0.10 per share. There were no preferred shares outstanding as of
December 31, 2015 and 2014.
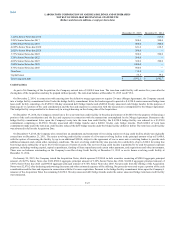
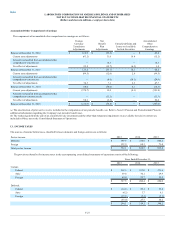
The changes in common shares issued and held in treasury are summarized below:
2015
2014
2013
Common stock issued at January 1 107.1
108.1
115.8
Common stock issued under employee stock plans 1.5
1.6
2.6
Common stock issued upon conversion of zero-coupon subordinated notes —
0.1
0.1
Common stock issued in conjunction with the Acquisition 15.3
—
—
Retirement of common stock —
(2.7)
(10.4)
Common stock issued at December 31 123.9
107.1
108.1
2015
2014
2013
Common shares held in treasury at January 1 22.5
22.4
22.3
Surrender of restricted stock and performance share awards 0.1
0.1
0.1
Common shares held in treasury at December 31 22.6
22.5
22.4
As of December 31, 2015, the Company had outstanding authorization from the Board of Directors to purchase $789.5 of Company common stock based
on settled trades as of these respective dates. The repurchase authorization has no expiration date. Following the announcement of the acquisition of
Covance, the Company suspended its share repurchases. The Company does not anticipate resuming its share repurchase activity until it approaches its
targeted leverage ratio of total debt to consolidated EBITDA of 2.5 to 1.0. However, the Company will continue to evaluate all opportunities for strategic
deployment of capital in light of market conditions.
F-26