LabCorp 2015 Annual Report Download - page 86
Download and view the complete annual report
Please find page 86 of the 2015 LabCorp annual report below. You can navigate through the pages in the report by either clicking on the pages listed below, or by using the keyword search tool below to find specific information within the annual report.-
 1
1 -
2
-
3
-
4
-
5
-
6
-
7
-
8
-
9
-
10
-
11
-
12
-
13
-
14
-
15
-
16
-
17
-
18
-
19
-
20
-
21
-
22
-
23
-
24
-
25
-
26
-
27
-
28
-
29
-
30
-
31
-
32
-
33
-
34
-
35
-
36
-
37
-
38
-
39
-
40
-
41
-
42
-
43
-
44
-
45
-
46
-
47
-
48
-
49
-
50
-
51
-
52
-
53
-
54
-
55
-
56
-
57
-
58
-
59
-
60
-
61
-
62
-
63
-
64
-
65
-
66
-
67
-
68
-
69
-
70
-
71
-
72
-
73
-
74
-
75
-
 76
76 -
 77
77 -
 78
78 -
 79
79 -
 80
80 -
 81
81 -
 82
82 -
 83
83 -
 84
84 -
 85
85 -
 86
86 -
 87
87 -
 88
88 -
 89
89 -
 90
90 -
 91
91 -
 92
92 -
 93
93 -
 94
94 -
 95
95 -
 96
96 -
97
-
98
-
99
-
100
-
101
-
102
-
103
-
104
-
105
-
106
-
107
-
108
-
109
-
110
-
111
-
112
-
113
-
114
-
115
-
116
-
117
-
118
-
119
-
120
-
121
-
122
-
123
-
124
-
125
-
126
-
127
-
128
-
129
-
130
-
131
-
132
-
133
-
134
-
135
-
136
-
137
-
138
-
139
-
140
-
141
-
142
-
143
-
144
-
145
-
146
-
147
-
148
-
149
-
150
-
151
 |
 |

Index
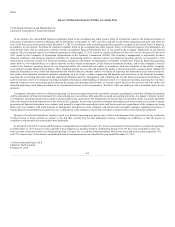
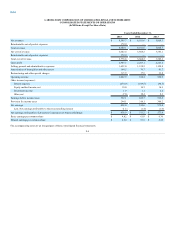
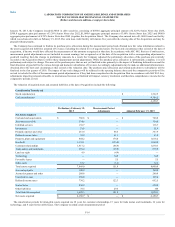
Net earnings $ 438.0
$ 512.6
$ 575.4
Adjustments to reconcile net earnings to net cash provided by operating activities:
Depreciation and amortization 457.8
245.5
230.1
Stock compensation 102.1
45.7
37.3
Loss (gain) on sale of assets 4.6
(12.5)
(3.9)
Accrued interest on zero-coupon subordinated notes 2.0
2.0
2.3
Cumulative earnings less than (in excess of) distributions from equity method investments 0.1
(5.8)
(4.2)
Asset impairment 39.7
—
—
Deferred income taxes (33.4)
27.7
56.2
Change in assets and liabilities (net of effects of acquisitions):
Increase in accounts receivable (net) (71.8)
(31.1)
(67.5)
Increase in unbilled services (16.9)
—
—
Increase in inventories (0.2)
(0.3)
(15.3)
Decrease (increase) in prepaid expenses and other 62.3
(12.9)
(32.3)
Increase (decrease) in accounts payable 30.7
(21.2)
60.8
Increase in deferred revenue 5.4
—
—
Decrease in accrued expenses and other (38.0)
(10.7)
(20.2)
Net cash provided by operating activities 982.4
739.0
818.7
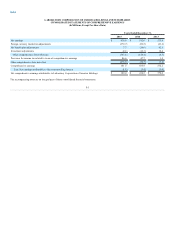
Capital expenditures (255.8)
(203.5)
(202.2)
Proceeds from sale of assets 0.6
1.4
1.1
Proceeds from sale of investments 8.0
31.6
7.5
Acquisition of licensing technology —
—
—
Investments in equity affiliates (11.7)
(20.2)
(6.5)
Acquisition of businesses, net of cash acquired (3,736.0)
(159.4)
(159.5)
Net cash used for investing activities (3,994.9)
(350.1)
(359.6)
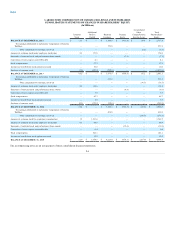
Proceeds from Senior Notes offerings 2,900.0
—
700.0
Proceeds from term loan 1,000.0
—
—
Payments on term loan (285.0)
—
—
Proceeds from revolving credit facilities 60.0
—
412.0
Payments on revolving credit facilities (60.0)
—
(412.0)
Proceeds from bridge loan 400.0
—
—
Payments on bridge loan (400.0)
—
—
Payments on Senior Notes (500.0)
—
—
Payments on zero-coupon subordinated notes (1.3)
(18.9)
(21.5)
Payments on long-term debt —
—
(350.0)
Payment of debt issuance costs (36.7)
(24.1)
(9.3)
Payments on long-term lease obligations (4.3)
(1.4)
(0.4)
Noncontrolling interest distributions —
(1.2)
(0.9)
Deferred payments on acquisitions (0.1)
(6.7)
(5.6)
Excess tax benefits from stock based compensation 13.1
5.9
11.0
Net proceeds from issuance of stock to employees 98.9
114.8
174.0
Purchase of common stock —
(269.0)
(1,015.6)
Net cash used for financing activities 3,184.6
(200.6)
(518.3)
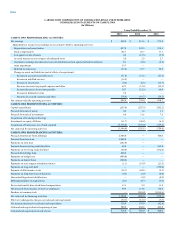
Effect of exchange rate changes on cash and cash equivalents (35.7)
(12.3)
(3.6)
Net increase (decrease) in cash and cash equivalents 136.4
176.0
(62.8)
Cash and cash equivalents at beginning of year 580.0
404.0
466.8
Cash and cash equivalents at end of year $ 716.4
$ 580.0
$ 404.0