LabCorp 2015 Annual Report Download - page 118
Download and view the complete annual report
Please find page 118 of the 2015 LabCorp annual report below. You can navigate through the pages in the report by either clicking on the pages listed below, or by using the keyword search tool below to find specific information within the annual report.-
 1
1 -
2
-
3
-
4
-
5
-
6
-
7
-
8
-
9
-
10
-
11
-
12
-
13
-
14
-
15
-
16
-
17
-
18
-
19
-
20
-
21
-
22
-
23
-
24
-
25
-
26
-
27
-
28
-
29
-
30
-
31
-
32
-
33
-
34
-
35
-
36
-
37
-
38
-
39
-
40
-
41
-
42
-
43
-
44
-
45
-
46
-
47
-
48
-
49
-
50
-
51
-
52
-
53
-
54
-
55
-
56
-
57
-
58
-
59
-
60
-
61
-
62
-
63
-
64
-
65
-
66
-
67
-
68
-
69
-
70
-
71
-
72
-
73
-
74
-
75
-
76
-
77
-
78
-
79
-
80
-
81
-
82
-
83
-
84
-
85
-
86
-
87
-
88
-
89
-
90
-
91
-
92
-
93
-
94
-
95
-
96
-
97
-
98
-
99
-
100
-
101
-
102
-
103
-
104
-
105
-
106
-
107
-
 108
108 -
 109
109 -
 110
110 -
 111
111 -
 112
112 -
 113
113 -
 114
114 -
 115
115 -
 116
116 -
 117
117 -
 118
118 -
 119
119 -
 120
120 -
 121
121 -
 122
122 -
 123
123 -
 124
124 -
 125
125 -
 126
126 -
 127
127 -
 128
128 -
129
-
130
-
131
-
132
-
133
-
134
-
135
-
136
-
137
-
138
-
139
-
140
-
141
-
142
-
143
-
144
-
145
-
146
-
147
-
148
-
149
-
150
-
151
 |
 |

Index
Year ended December 31,
2015
2014
2013
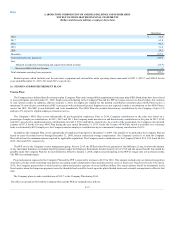
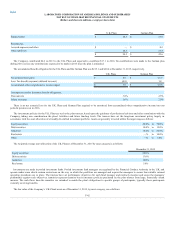
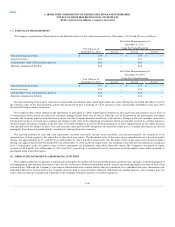
Service cost for benefits earned $ 3.9
$ 3.4
$ 3.1
Interest cost on benefit obligation 15.1
16.4
14.7
Expected return on plan assets (18.3)
(18.3)
(17.3)
Net amortization and deferral 11.3
6.6
10.5
Defined benefit plan costs $ 12.0
$ 8.1
$ 11.0
Amounts included in accumulated other comprehensive earnings consist of unamortized net loss of $135.1. The accumulated other comprehensive
earnings that are expected to be recognized as components of the defined benefit plan costs during 2016 are $10.5 related to amortization of the net loss.
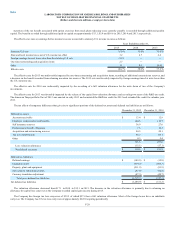
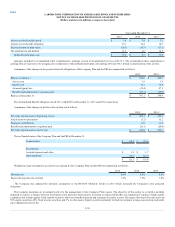
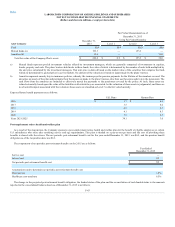
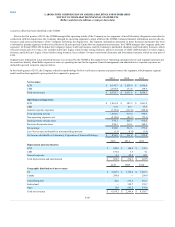
A summary of the changes in the projected benefit obligations of the Company Plan and the PEP are summarized as follows:
2015
2014
Balance at January 1 $ 388.6
$ 349.7
Service cost 3.9
3.4
Interest cost 15.1
16.4
Actuarial (gain)/loss (15.4)
47.1
Benefits and administrative expenses paid (29.1)
(28.0)
Balance at December 31 $ 363.1
$ 388.6
The Accumulated Benefit Obligation was $363.1 and $388.6 at December 31, 2015 and 2014, respectively.
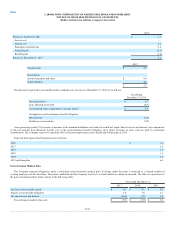
A summary of the changes in the fair value of plan assets follows:
2015
2014
Fair value of plan assets at beginning of year $ 269.1
$ 268.1
Actual return on plan assets (5.2)
15.2
Employer contributions 11.0
13.8
Benefits and administrative expenses paid (29.1)
(28.0)
Fair value of plan assets at end of year $ 245.8
$ 269.1
The net funded status of the Company Plan and the PEP at December 31:
Funded status $ 112.5
$ 119.6
Recorded as:
Accrued expenses and other $ 1.9
$ 1.7
Other liabilities 110.6
117.9
$ 112.5
$ 119.6
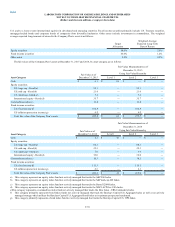
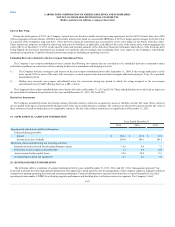
Weighted average assumptions used in the accounting for the Company Plan and the PEP are summarized as follows:
2015
2014
2013
Discount rate 4.0%
4.8%
4.8%
Expected long term rate of return 7.0%
7.0%
7.0%
The Company also updated the mortality assumption to the RP-2014 Mortality Tables in 2015 which increased the Company's total projected
obligation.
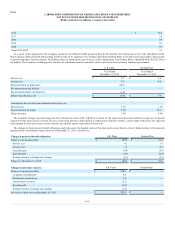
The Company maintains an investment policy for the management of the Company Plan’s assets. The objective of this policy is to build a portfolio
designed to achieve a balance between investment return and asset protection by investing in indexed funds that are comprised of equities of high quality
companies and in high quality fixed income securities which are broadly balanced and represent all market sectors. The target allocations for plan assets are
50% equity securities, 45% fixed income securities and 5% in other assets. Equity securities primarily include investments in large-cap, mid-cap and small-
cap companies located in the
F-38