Lowe's 2006 Annual Report Download - page 23
Download and view the complete annual report
Please find page 23 of the 2006 Lowe's annual report below. You can navigate through the pages in the report by either clicking on the pages listed below, or by using the keyword search tool below to find specific information within the annual report.-
 1
1 -
2
-
3
-
4
-
5
-
6
-
7
-
8
-
9
-
10
-
11
-
12
-
 13
13 -
 14
14 -
 15
15 -
 16
16 -
 17
17 -
 18
18 -
 19
19 -
 20
20 -
 21
21 -
 22
22 -
 23
23 -
 24
24 -
 25
25 -
 26
26 -
 27
27 -
 28
28 -
 29
29 -
 30
30 -
 31
31 -
 32
32 -
 33
33 -
34
-
35
-
36
-
37
-
38
-
39
-
40
-
41
-
42
-
43
-
44
-
45
-
46
-
47
-
48
-
49
-
50
-
51
-
52
-
53
-
54
 |
 |

19
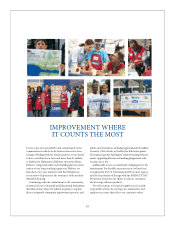
Lowe’s 2006 Annual Report
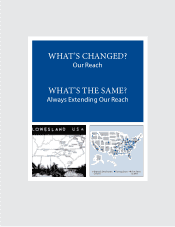
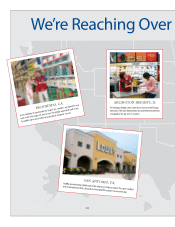
New store expansion
We have considerable growth opportunities and see the potential for over
2,000 stores in North America with our current prototypes. In 2006, we
opened 155 stores (151 new and four relocated) in markets around the
country, bringing our total to 1,385 stores in 49 states. We plan to open
another 150 to 160 stores in 2007, including our rst stores in Toronto,
Canada in the second half of 2007. We also announced our intention to
enter Mexico with plans for three to ve stores in Monterrey in 2009.
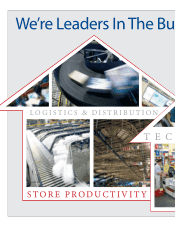
Improving Operating Eciency
Store productivity
We are focused on improving store productivity and operational eciency.
e more productive our employees are on tasks, the more time they
have to assist customers. e basics of sustaining productivity include
assessing the value of tasks performed, accurate planning of sales and
hours, ensuring our employees are scheduled when customers are shop-
ping, and monitoring key labor metrics. We will also continue to ensure
that our employee base includes tenured and talented people at all levels of
the organization to fuel growth and maintain our commitment to service.
We are also working to further enhance our sales culture by continuously
providing training for our team and improving our service. Customers tell
us that they want knowledgeable sales people, so we will continue to focus
on expanding our employees’ product knowledge.
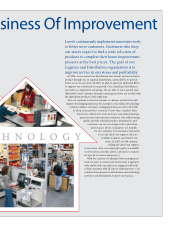
Merchandising
One way we seek to increase sales is by eectively using displays, signage,
adjacencies and product packaging as tools to enhance the shopping
experience. When customers can easily identify features and benets,
compare product choices and shop for related purchases nearby, they
purchase more. When packaging is consistent and informative, when
allocated space has enough holding power to satisfy demand and when
store employees keep the displays stocked and shopable, our customers’
experience is enhanced. When signage is clear, concise and gives customers
information they need to make a buying decision, they will also purchase
more. is is the operationally ecient merchandising approach that
continues to drive sales in our stores.
Distribution network
Our distribution network supports new store expansion and improves
operating eciency. To improve the service and eciency of this network,
our largest initiative over the past couple of years was Rapid Response
Replenishment (R3), which encompassed numerous supply chain enhance-
ments that would allow us to more eectively and eciently move product
to our stores in changing demand environments. at platform is rmly
in place and is now our standard operating model. Many years of invest-
ment in and renement of our logistics and distribution organization
have made it one of our key competitive advantages. e organization is
focused on improving service to our stores, increasing eciency and
improving inventory productivity. On average in 2006, nearly 70% of the
stock merchandise we purchased was shipped through our distribution
network, while the remaining portion was shipped directly to stores from
vendors. In the fourth quarter of 2006, we reached nearly 75%. As evidence
of the eectiveness gained from our distribution network, both compa-
rable stores and distribution center inventories were down slightly versus
the prior year.
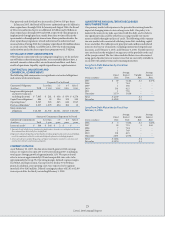
CRITICAL ACCOUNTING POLICIES AND ESTIMATES
e following discussion and analysis of our nancial condition and
results of operations are based on the consolidated nancial statements
and notes to consolidated nancial statements presented in this annual
report that have been prepared in accordance with accounting principles
generally accepted in the United States of America. e preparation of
these nancial statements requires us to make estimates that aect the
reported amounts of assets, liabilities, sales and expenses, and related
disclosures of contingent assets and liabilities. We base these estimates on
historical results and various other assumptions believed to be reasonable,
all of which form the basis for making estimates concerning the carrying
values of assets and liabilities that are not readily available from other
sources. Actual results may dier from these estimates.
Our signicant accounting policies are described in Note 1 to the
consolidated nancial statements. We believe that the following account-
ing policies aect the more signicant estimates used in preparing the
consolidated nancial statements.
Merchandise Inventory
Description
We record an inventory reserve for the loss associated with selling
inventories below cost. is reserve is based on our current knowledge
with respect to inventory levels, sales trends and historical experience.
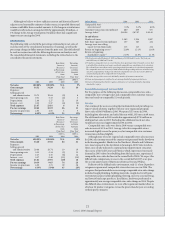
During 2006, our reserve decreased $38 million to $66 million as of
February 2, 2007, as a result of better sell-through of obsolete or slow-
moving inventory. We also record an inventory reserve for the estimated
shrinkage between physical inventories. is reserve is based primarily
on actual shrinkage results from previous physical inventories. During
2006, the inventory shrinkage reserve increased $16 million to $129 mil-
lion as of February 2, 2007.
Judgments and uncertainties involved in the estimate
We do not believe that our merchandise inventories are subject to signicant
risk of obsolescence in the near term, and we have the ability to adjust purchas-
ing practices based on anticipated sales trends and general economic condi-
tions. However, changes in consumer purchasing patterns could result in
the need for additional reserves. Likewise, changes in the estimated shrink
reserve may be necessary, based on the results of physical inventories.
Eect if actual results dier from assumptions
Although we believe that we have sufficient current and historical
knowledge to record reasonable estimates for both of these inventory
reserves, it is possible that actual results could dier from recorded reserves.
A 10% change in our obsolete inventory reserve would have aected net
earnings by approximately $4 million for 2006. A 10% change in our esti-
mated shrinkage reserve would have aected net earnings by approximately
$8 million for 2006.
Vendor Funds
Description
We receive funds from vendors in the normal course of business, principally
as a result of purchase volumes, sales, early payments, or promotions of
vendors’ products.
Under Emerging Issues Task Force Issue No. 02-16 (EITF 02-16),
“Accounting by a Customer (Including a Reseller) for Certain Consideration
Received from a Vendor,” vendor funds are treated as a reduction of inventory
cost, unless they represent a reimbursement of specic, incremental and
identiable costs incurred by the customer to sell the vendor’s product.