Lowe's 2006 Annual Report Download - page 32
Download and view the complete annual report
Please find page 32 of the 2006 Lowe's annual report below. You can navigate through the pages in the report by either clicking on the pages listed below, or by using the keyword search tool below to find specific information within the annual report.-
 1
1 -
2
-
3
-
4
-
5
-
6
-
7
-
8
-
9
-
10
-
11
-
12
-
13
-
14
-
15
-
16
-
17
-
18
-
19
-
20
-
21
-
 22
22 -
 23
23 -
 24
24 -
 25
25 -
 26
26 -
 27
27 -
 28
28 -
 29
29 -
 30
30 -
 31
31 -
 32
32 -
 33
33 -
 34
34 -
 35
35 -
 36
36 -
 37
37 -
 38
38 -
 39
39 -
 40
40 -
 41
41 -
 42
42 -
43
-
44
-
45
-
46
-
47
-
48
-
49
-
50
-
51
-
52
-
53
-
54
 |
 |

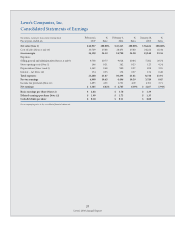
Lowe’s Companies, Inc.
Consolidated Statements of Earnings
(In millions, except per share and percentage data)
February 2, % February 3, % January 28, %
Fiscal years ended on
2007 Sales 2006 Sales 2005 Sales
Net sales (Note 1) $ 46,927 100.00% $ 43,243 100.00% $ 36,464 100.00%
Cost of sales (Notes 1 and 15) 30,729 65.48 28,453 65.80 24,224 66.44
Gross margin 16,198 34.52 14,790 34.20 12,240 33.56
Expenses:
Selling, general and administrative (Notes 1, 4 and 9) 9,738 20.75 9,014 20.84 7,562 20.74
Store opening costs (Note 1) 146 0.31 142 0.33 123 0.34
Depreciation (Notes 1 and 3) 1,162 2.48 980 2.27 859 2.35
Interest – net (Note 16) 154 0.33 158 0.37 176 0.48
Total expenses 11,200 23.87 10,294 23.81 8,720 23.91
Pre-tax earnings 4,998 10.65 4,496 10.39 3,520 9.65
Income tax provision (Note 11) 1,893 4.03 1,731
4.00 1,353 3.71
Net earnings $ 3,105 6.62% $ 2,765 6.39% $ 2,167 5.94%
Basic earnings per share (Note 12) $ 2.02 $ 1.78 $ 1.39
Diluted earnings per share (Note 12) $ 1.99 $ 1.73 $ 1.35
Cash dividends per share
$ 0.18
$ 0.11 $ 0.08
See accompanying notes to the consolidated nancial statements.
28
Lowe’s 2006 Annual Report