Lowe's 2006 Annual Report Download - page 29
Download and view the complete annual report
Please find page 29 of the 2006 Lowe's annual report below. You can navigate through the pages in the report by either clicking on the pages listed below, or by using the keyword search tool below to find specific information within the annual report.-
 1
1 -
2
-
3
-
4
-
5
-
6
-
7
-
8
-
9
-
10
-
11
-
12
-
13
-
14
-
15
-
16
-
17
-
18
-
 19
19 -
 20
20 -
 21
21 -
 22
22 -
 23
23 -
 24
24 -
 25
25 -
 26
26 -
 27
27 -
 28
28 -
 29
29 -
 30
30 -
 31
31 -
 32
32 -
 33
33 -
 34
34 -
 35
35 -
 36
36 -
 37
37 -
 38
38 -
 39
39 -
40
-
41
-
42
-
43
-
44
-
45
-
46
-
47
-
48
-
49
-
50
-
51
-
52
-
53
-
54
 |
 |

25
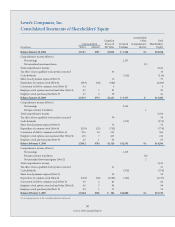
Lowe’s 2006 Annual Report
Our quarterly cash dividend was increased in 2006 to $.05 per share.
In January 2005, the Board of Directors authorized up to $1 billion in
share repurchases through 2006. In January and August 2006, the Board
of Directors authorized up to an additional $1 billion and $2 billion in
share repurchases through 2007 and 2008, respectively. is program is
implemented through purchases made from time to time either in the
open market or through private transactions. Shares purchased under the
share repurchase program are retired and returned to authorized and
unissued status. During 2006, the Company repurchased 56.8 million shares
at a total cost of $1.7 billion. As of February 2, 2007, the total remaining
authorization under the share repurchase program was $1.5 billion.
OFF-BALANCE SHEET ARRANGEMENTS
Other than in connection with executing operating leases, we do not have
any o-balance sheet nancing that has, or is reasonably likely to have, a
material, current or future eect on our nancial condition, cash ows,
results of operations, liquidity, capital expenditures or capital resources.
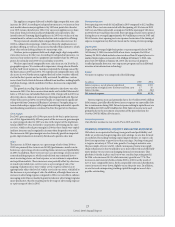
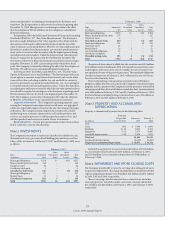
CONTRACTUAL OBLIGATIONS AND
COMMERCIAL COMMITMENTS
e following table summarizes our signicant contractual obligations
and commercial commitments:
Payments Due by Period
Contractual Obligations Less than 1-3 4-5 Aer 5
(In millions) Total 1 year years years years
Long-term debt (principal
and interest amounts,
excluding discount) $ 7,865 $ 281 $ 438 $ 870 $ 6,276
Capital lease obligations1 644 62 124 123 335
Operating leases1 5,527 323 645 642 3,917
Purchase obligations2 2,307 1,079 834 382 12
Total contractual
obligations $ 16,343 $ 1,745 $ 2,041 $2,017 $ 10,540
Amount of Commitment Expiration by Period
Commercial
Commitments
Less than 1-3 4-5 Aer 5
(In millions) Total 1 year years years years
Letters of credit3 $ 346 $ 344 $ 2 $ – $ –
1 Amounts do not include taxes, common area maintenance, insurance or contingent rent because
these amounts have historically been insignicant.
2 Represents contracts for purchases of merchandise inventory, property and construction of buildings,
as well as commitments related to certain marketing and information technology programs.
3 Letters of credit are issued for the purchase of import merchandise inventories, real estate and
construction contracts, and insurance programs.
COMPANY OUTLOOK
As of February 23, 2007, the date of our fourth quarter 2006 earnings
release, we expected to open 150 to 160 stores during 2007, resulting in
total square footage growth of approximately 11%. We expected total
sales to increase approximately 10% and comparable store sales to be
approximately at to up 2%. Operating margin, dened as gross margin
less SG&A and depreciation, was expected to decline 70 to 80 basis
points. In addition, store opening costs were expected to be approxi-
mately $140 to $145 million. Diluted earnings per share of $2.02 to $2.09
were expected for the scal year ending February 1, 2008.
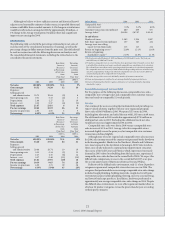
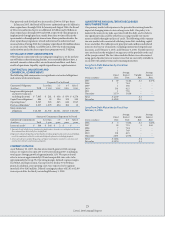
QUANTITATIVE AND QUALITATIVE DISCLOSURES
ABOUT MARKET RISK
Our primary market risk exposure is the potential loss arising from the
impact of changing interest rates on long-term debt. Our policy is to
monitor the interest rate risks associated with this debt, and we believe
any signicant risks could be oset by accessing variable rate instru-
ments available through our lines of credit. e following tables summa-
rize our market risks associated with long-term debt, excluding capital
leases and other. e tables present principal cash outows and related
interest rates by year of maturity, excluding unamortized original issue
discounts as of February 2, 2007, and February 3, 2006. Variable interest
rates are based on the weighted-average rates of the portfolio at the end
of the year presented. e fair values included below were determined
using quoted market rates or interest rates that are currently available to
us on debt with similar terms and remaining maturities.
Long-Term Debt Maturities by Fiscal Year
February 2, 2007
Average Average
Fixed Interest Variable Interest
(Dollars in millions) Rate Rate Rate Rate
2007 $ 59 7.24% $ 2 6.57%
2008 7 7.84 – –
2009 1 5.96 – –
2010 501 8.25 – –
2011 1 7.50 – –
ereaer 3,570 5.02% – –
Total $ 4,139 $ 2
Fair value $ 4,299 $ 2
Long-Term Debt Maturities by Fiscal Year
February 3, 2006
Average Average
Fixed Interest Variable Interest
(Dollars in millions) Rate Rate Rate Rate
2006 $ 5 7.58% $ 2 5.82%
2007 59 7.25 2 5.82
2008 7 7.84 – –
2009 1 7.49 – –
2010 501 8.25 – –
ereaer 2,691 4.70% – –
Total $ 3,264 $ 4
Fair value $ 3,574 $ 4