Lowe's 2006 Annual Report Download - page 50
Download and view the complete annual report
Please find page 50 of the 2006 Lowe's annual report below. You can navigate through the pages in the report by either clicking on the pages listed below, or by using the keyword search tool below to find specific information within the annual report.-
 1
1 -
2
-
3
-
4
-
5
-
6
-
7
-
8
-
9
-
10
-
11
-
12
-
13
-
14
-
15
-
16
-
17
-
18
-
19
-
20
-
21
-
22
-
23
-
24
-
25
-
26
-
27
-
28
-
29
-
30
-
31
-
32
-
33
-
34
-
35
-
36
-
37
-
38
-
39
-
 40
40 -
 41
41 -
 42
42 -
 43
43 -
 44
44 -
 45
45 -
 46
46 -
 47
47 -
 48
48 -
 49
49 -
 50
50 -
 51
51 -
 52
52 -
 53
53 -
 54
54
 |
 |

46
Lowe’s 2006 Annual Report
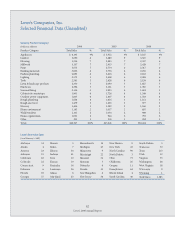
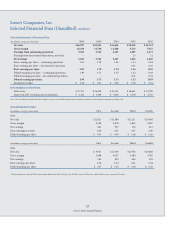
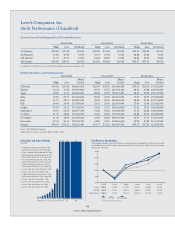
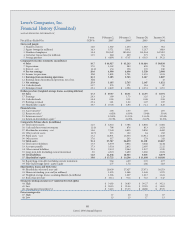
Lowe’s Companies, Inc.
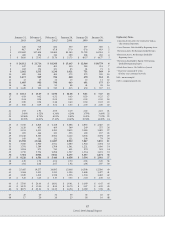
Financial History (Unaudited)
10YEAR FINANCIAL INFORMATION 1
5-year February 2, February 3, January 28, January 30,
Fiscal Years Ended On CGR % 2007 2006* 2005 2004
Stores and people
1 Number of stores 14.0 1,385 1,234 1,087 952
2 Square footage (in millions) 14.3 157.1 140.1 123.7 108.8
3 Number of employees 14.4 210,142 185,314 161,964 147,052
4 Customer transactions (in millions) 11.5 680 639 575 521
5 Average purchase $ 68.98 $ 67.67 $ 63.43 $ 59.21
Comparative income statements (in millions)
6 Sales 16.7 $ 46,927 $ 43,243 $ 36,464 $ 30,838
7 Depreciation 17.9 1,162 980 859 739
8 Interest – net (2.4) 154 158 176 180
9 Pre-tax earnings 26.6 4,998 4,496 3,520 2,908
10 Income tax provision NM 1,893 1,731 1,353 1,101
11 Earnings from continuing operations 26.2 3,105 2,765 2,167 1,807
12 Earnings from discontinued operations, net of tax NM – – – 15
13 Net earnings 25.9 3,105 2,765 2,167 1,822
14 Cash dividends 35.7 276 171 116 87
15 Earnings retained
25.1 $ 2,829 $ 2,594 $ 2,051 $ 1,735
Dollars per share (weighted-average shares, assuming dilution)
16 Sales 17.3 $ 29.97 $ 26.91 $ 22.55 $ 18.91
17 Earnings 26.3 1.99 1.73 1.35 1.13
18 Cash dividends 36.4 0.18 0.11 0.08 0.06
19 Earnings retained 25.4 1.81 1.62 1.27 1.07
20 Shareholders’ equity 19.7 $ 10.04 $ 8.90 $ 7.11 $ 6.25
Financial ratios
21 Asset turnover 2 1.90 2.05 1.95 1.95
22 Return on sales 3 6.62% 6.39% 5.94% 5.91%
23 Return on assets 4 12.60% 13.10% 11.61% 11.54%
24 Return on shareholders’ equity
5
21.72% 24.05% 21.27% 22.15%
Comparative balance sheets (in millions)
25 Total current assets 11.5 $ 8,314 $ 7,788 $ 6,866 $ 6,438
26 Cash and short-term investments (1.4) 796 876 813 1,624
27 Merchandise inventory – net 14.6 7,144 6,635 5,850 4,482
28 Other current assets (2.7) 213 122 84 252
29 Fixed assets – net 17.2 18,971 16,354 13,911 11,819
30 Other assets 17.6 317 203 178 241
31 Total assets 15.4 27,767 24,639 21,101 18,667
32 Total current liabilities 17.3 6,539 5,832 5,648 4,144
33 Accounts payable 17.3 3,524 2,832 2,695 2,212
34 Other current liabilities 21.1 2,532 2,544 1,937 1,520
35 Long-term debt (excluding current maturities) 3.0 4,325 3,499 3,060 3,678
36 Total liabilities 11.6 12,042 10,343 9,603 8,479
37 Shareholders’ equity 19.0 $ 15,725 $ 14,296 $ 11,498 $ 10,188
38 Equity/long-term debt (excluding current maturities) 3.64 4.09 3.76 2.77
39 Year-end leverage factor: assets/equity 1.77 1.72 1.84 1.83
Shareholders, shares and book value
40 Shareholders of record, year-end 29,439 27,427 27,071 26,553
41 Shares outstanding, year-end (in millions) 1,525 1,568 1,548 1,575
42 Weighted-average shares, assuming dilution (in millions) 1,566 1,607 1,617 1,631
43 Book value per share $ 10.31 $ 9.12 $ 7.43 $ 6.47
Stock price during calendar year 6 (adjusted for stock splits)
44 High $ 34.83 $ 34.85 $ 30.27 $ 30.21
45 Low $ 26.15 $ 25.36 $ 22.95 $ 16.69
46 Closing price December 31 $ 31.15 $ 33.33 $ 28.80 $ 27.70
Price/earnings ratio
47 High 17 20 22 27
48 Low 13 15 17 15