Lowe's 2006 Annual Report Download - page 33
Download and view the complete annual report
Please find page 33 of the 2006 Lowe's annual report below. You can navigate through the pages in the report by either clicking on the pages listed below, or by using the keyword search tool below to find specific information within the annual report.-
 1
1 -
2
-
3
-
4
-
5
-
6
-
7
-
8
-
9
-
10
-
11
-
12
-
13
-
14
-
15
-
16
-
17
-
18
-
19
-
20
-
21
-
22
-
 23
23 -
 24
24 -
 25
25 -
 26
26 -
 27
27 -
 28
28 -
 29
29 -
 30
30 -
 31
31 -
 32
32 -
 33
33 -
 34
34 -
 35
35 -
 36
36 -
 37
37 -
 38
38 -
 39
39 -
 40
40 -
 41
41 -
 42
42 -
 43
43 -
44
-
45
-
46
-
47
-
48
-
49
-
50
-
51
-
52
-
53
-
54
 |
 |

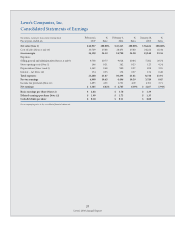
29
Lowe’s 2006 Annual Report
February 2, % February 3, %
(In millions, except per value and percentage data)
2007 Total 2006 Total
Assets
Current assets:
Cash and cash equivalents (Note 1) $ 364 1.3% $ 423 1.7%
Short-term investments (Notes 1 and 2) 432 1.6 453 1.8
Merchandise inventory – net (Note 1) 7,144 25.7 6,635 27.0
Deferred income taxes – net (Note 11) 161 0.6 155 0.6
Other current assets 213 0.8 122 0.5
Total current assets 8,314 30.0 7,788 31.6
Property, less accumulated depreciation (Notes 3 and 4) 18,971 68.3 16,354 66.4
Long-term investments (Notes 1 and 2) 165 0.6 294 1.2
Other assets (Notes 1 and 4) 317 1.1 203 0.8
Total assets $ 27,767 100.0% $ 24,639 100.0%
Liabilities and shareholders’ equity
Current liabilities:
Short-term borrowings (Note 5) $ 23 0.1% $ – –%
Current maturities of long-term debt (Note 6) 88 0.3 32 0.1
Accounts payable 3,524 12.7 2,832 11.6
Accrued salaries and wages 372 1.3 424 1.7
Self-insurance liabilities (Note 1) 650 2.4 571 2.3
Deferred revenue (Note 1) 731 2.6 709 2.9
Other current liabilities (Notes 1 and 4) 1,151 4.1 1,264 5.1
Total current liabilities 6,539 23.5 5,832 23.7
Long-term debt, excluding current maturities (Notes 6, 7 and 13) 4,325 15.6 3,499 14.2
Deferred income taxes –net (Note 11) 735 2.7 735 3.0
Other long-term liabilities (Note 1) 443 1.6 277 1.1
Total liabilities 12,042 43.4 10,343 42.0
Commitments and contingencies (Note 14)
Shareholders’ equity (Note 8):
Preferred stock – $5 par value, none issued – – – –
Common stock – $.50 par value;
Shares issued and outstanding
February 2, 2007 1,525
February 3, 2006 1,568 762 2.7 784 3.2
Capital in excess of par value 102 0.4 1,320 5.3
Retained earnings 14,860 53.5 12,191 49.5
Accumulated other comprehensive income (Note 1) 1 – 1 –
Total shareholders’ equity 15,725 56.6 14,296 58.0
Total liabilities and shareholders’ equity $ 27,767 100.0% $ 24,639 100.0%
See accompanying notes to the consolidated nancial statements.
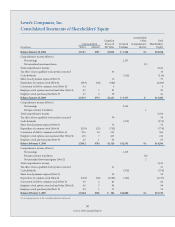
Lowe’s Companies, Inc.
Consolidated Balance Sheets