Lowe's 2006 Annual Report Download - page 51
Download and view the complete annual report
Please find page 51 of the 2006 Lowe's annual report below. You can navigate through the pages in the report by either clicking on the pages listed below, or by using the keyword search tool below to find specific information within the annual report.-
 1
1 -
2
-
3
-
4
-
5
-
6
-
7
-
8
-
9
-
10
-
11
-
12
-
13
-
14
-
15
-
16
-
17
-
18
-
19
-
20
-
21
-
22
-
23
-
24
-
25
-
26
-
27
-
28
-
29
-
30
-
31
-
32
-
33
-
34
-
35
-
36
-
37
-
38
-
39
-
40
-
 41
41 -
 42
42 -
 43
43 -
 44
44 -
 45
45 -
 46
46 -
 47
47 -
 48
48 -
 49
49 -
 50
50 -
 51
51 -
 52
52 -
 53
53 -
 54
54
 |
 |

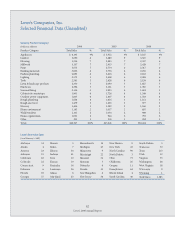
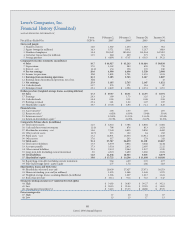
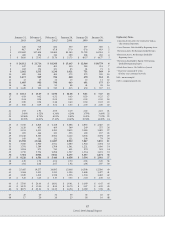
47
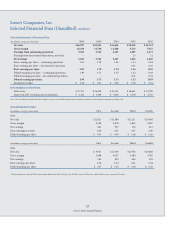
Lowe’s 2006 Annual Report
January 31, February 1, February 2, January 28, January 29, January 30,
2003 2002 2001* 2000 1999 1998
1 828 718 624 550 497 456 1
2 94.7 80.7 67.8 57.0 47.8 39.9 2
3 120,692 107,404 93,669 85,145 71,792 63,261 3
4 460 394 342 299 268 230 4
5 $ 56.80 $ 55.05 $ 53.78 $ 51.73 $ 48.37 $ 46.77 5
6 $ 26,112 $ 21,714 $ 18,368 $ 15,445 $ 12,946 $ 10,779 6
7 617 509 403 330 283 251 7
8 182 174 121 85 81 71 8
9 2,362 1,535 1,238 1,021 751 569 9
10 889 566 454 373 273 205 10
11 1,473 969 784 648 478 364 11
12 12 13 14 15 13 11 12
13 1,485 982 798 663 491 375 13
14 66 60 53 48 41 38 14
15 $ 1,419 $ 922 $ 745 $ 615 $ 450 $ 337
15
16 $ 16.12 $ 13.49 $ 11.94 $ 10.06 $ 8.61 $ 7.27 16
17 0.93 0.62 0.52 0.43 0.33 0.25 17
18 0.04 0.04 0.04 0.03 0.03 0.03 18
19 0.89 0.58 0.48 0.40 0.30 0.22 19
20 $ 5.08 $ 4.09 $ 3.54 $ 3.03 $ 2.39 $ 2.00 20
21 1.93 1.92 2.05 2.19 2.22 2.16 21
22 5.69% 4.52% 4.34% 4.29% 3.79% 3.48% 22
23 10.96% 8.70% 8.91% 9.41% 8.42% 7.52% 23
24 22.55% 18.03% 17.13% 18.45% 16.58% 14.66% 24
25 $ 5,356 $ 4,818 $ 4,158 $ 3,688 $ 2,865 $ 2,427 25
26 1,126 853 469 569 249 275 26
27 3,911 3,611 3,285 2,812 2,385 1,985 27
28 265 244 323 253 189 157 28
29 10,245 8,565 6,964 5,122 4,046 3,294 29
30 160 141 131 111 108 79 30
31 15,790 13,546 11,287 8,952 7,047 5,835 31
32 3,360 2,940 2,911 2,380 1,924 1,554 32
33 1,791 1,589 1,708 1,561 1,221 1,036 33
34 1,204 971 745 401 270 241 34
35 3,736 3,734 2,698 1,727 1,364 1,191 35
36 7,564 6,962 5,841 4,293 3,453 2,874 36
37 $ 8,226 $ 6,584 $ 5,446 $ 4,658 $ 3,594 $ 2,961 37
38 2.20 1.76 2.02 2.70 2.63 2.49 38
39 1.92 2.06 2.07 1.92 1.96 1.97 39
40 25,405 19,277 16,895 15,446 14,508 12,386 40
41 1,564 1,551 1,533 1,529 1,498 1,477 41
42 1,620 1,610 1,538 1,536 1,504 1,482 42
43 $ 5.26 $ 4.25 $ 3.55 $ 3.05 $ 2.40 $ 2.00 43
44 $ 25.00 $ 24.44 $ 16.81 $ 16.61 $ 14.69 $ 6.45 44
45 $ 16.25 $ 12.40 $ 8.56 $ 10.75 $ 5.97 $ 4.05 45
46 $ 18.75 $ 23.21 $ 11.13 $ 14.94 $ 12.80 $ 5.96 46
47 27 40 32 39 45 25 47
48 17 20 16 25 18 16 48
Explanatory Notes:
1 Amounts herein reect the Contractor Yards as
a discontinued operation.
2 Asset Turnover: Sales divided by Beginning Assets
3 Return on Sales: Net Earnings divided by Sales
4 Return on Assets: Net Earnings divided by
Beginning Assets
5 Return on Shareholders’ Equity: Net Earnings
divided by Beginning Equity
6 Stock Price Source: e Wall Street Journal
* Fiscal year contained 53 weeks.
All other years contained 52 weeks.
NM = not meaningful
CGR = compound growth rate