Lowe's 2006 Annual Report Download - page 48
Download and view the complete annual report
Please find page 48 of the 2006 Lowe's annual report below. You can navigate through the pages in the report by either clicking on the pages listed below, or by using the keyword search tool below to find specific information within the annual report.-
 1
1 -
2
-
3
-
4
-
5
-
6
-
7
-
8
-
9
-
10
-
11
-
12
-
13
-
14
-
15
-
16
-
17
-
18
-
19
-
20
-
21
-
22
-
23
-
24
-
25
-
26
-
27
-
28
-
29
-
30
-
31
-
32
-
33
-
34
-
35
-
36
-
37
-
 38
38 -
 39
39 -
 40
40 -
 41
41 -
 42
42 -
 43
43 -
 44
44 -
 45
45 -
 46
46 -
 47
47 -
 48
48 -
 49
49 -
 50
50 -
 51
51 -
 52
52 -
 53
53 -
 54
54
 |
 |

44
Lowe’s 2006 Annual Report
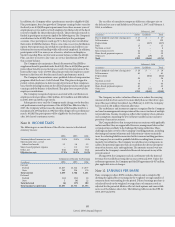
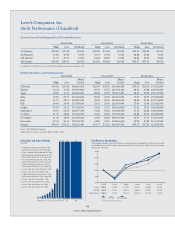
Quarterly Stock Price Range and Cash Dividend Payment
Fiscal 2006 Fiscal 2005 Fiscal 2004
High Low Dividend High Low Dividend High Low Dividend
1st Quarter $34.83 $30.58 $0.030 $29.99 $25.36 $0.020 $29.33 $25.85 $0.015
2nd Quarter 32.85 26.90 0.050 33.51 25.94 0.030 28.08 23.84 0.020
3rd Quarter 31.55 26.15 0.050 34.48 28.92 0.030 28.88 22.95 0.020
4th Quarter
$34.65 $28.59 $0.050 $34.85 $29.83 $0.030 $30.27 $27.53 $0.020
As of March 23, 2007 there were 31,770 registered holders of Lowe’s common stock.
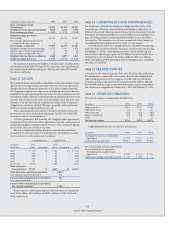
Monthly Stock Price and Trading Volume
Fiscal 2006 Fiscal 2005 Fiscal 2004
Shares Shares Shares
High Low Traded High Low Traded High Low Traded
February $34.83 $30.58 148,615,200 $29.99 $28.32 116,188,200 $29.33 $26.40 147,812,800
March 34.43 31.94 176,907,800 29.54 27.87 142,744,400 28.47 25.89 168,190,600
April
32.85
31.15 143,440,400 28.68 25.36 154,511,600 28.15 25.85 150,115,000
May 32.85 29.57 165,476,000 29.00 25.94 163,110,000 27.25 24.05 191,581,800
June 31.75 28.72 176,997,400 30.00 28.26 128,618,000 28.08 25.94 147,711,800
July 29.84 26.90 177,045,100 33.51 28.50 142,070,000 27.05 23.84 151,542,600
August 29.95 26.15 177,348,900 33.49 31.15 190,463,800 25.45 22.95 162,209,800
September 30.07 26.76 228,877,300 34.48 30.62 172,644,600 27.50 24.80 138,108,800
October 31.55 28.80 175,250,300 32.60 28.92 179,358,200 28.88 26.95 123,449,600
November 31.43 28.59 201,035,600 33.94 29.83 186,558,400 30.27 27.53 154,472,000
December 32.50 30.15 170,769,300 34.85 33.25 120,841,600 29.78 27.82 111,517,600
January $34.65 $31.13 136,214,400 $33.71 $31.53 146,092,200 $29.17 $27.54 112,605,000
Source: e Wall Street Journal
Adjusted for the 2-for-1 stock split, eective July 3, 2006.
Lowe’s Companies, Inc.
Stock Performance (Unaudited)
Stock Splits and Stock Dividends
Since 1961
• A 100% stock dividend, effective April 5, 1966
(which had the net effect of a 2-for-1 stock split).
• A 2-for-1 stock split, effective November 18, 1969.
• A 50% stock dividend, effective November 30, 1971
(which had the net effect of a 3-for-2 stock split).
• A 331⁄3% stock dividend, effective July 25, 1972
(which had the net effect of a 4-for-3 stock split).
• A 50% stock dividend, effective June 2, 1976
(which had the net effect of a 3-for-2 stock split).
• A 3-for-2 stock split, effective November 2, 1981.
• A 5-for-3 stock split, effective April 29, 1983.
• A 100% stock dividend, effective June 29, 1992
(which had the net effect of a 2-for-1 stock split).
• A 2-for-1 stock split, effective April 4, 1994.
• A 2-for-1 stock split, effective June 29, 1998.
• A 2-for-1 stock split, effective July 2, 2001.
• A 2-for-1 stock split, effective July 3, 2006.
61
480
240
12468
12
18
30
60
120 960
Total Return to Shareholders
The following table and graph compare the total returns (assuming reinvestment of dividends) of the Company’s Common Stock,
the S&P 500 Index and the S&P Retail Index. The graph assumes $100 invested on February 1, 2002 in the Company’s Common
Stock and each of the indices.
$60
$80
$100
$120
$140
$160
2/2/07
$151.96
$141.09
$154.69
2/3/06
$140.50
$120.84
$132.70
1/28/05
$123.81
$109.89
$123.56
1/30/04
$117.68
$104.33
$107.54
1/31/03
$74.95
$77.53
$71.95
2/1/02
$100.00
$100.00
$100.00
Lowe’s
S&P 500
S&P Retail Index
Source: Bloomberg Financial Services
S&P 500Lowe’s S&P Retail Index
060198949283817672716966