Lowe's 2006 Annual Report Download - page 49
Download and view the complete annual report
Please find page 49 of the 2006 Lowe's annual report below. You can navigate through the pages in the report by either clicking on the pages listed below, or by using the keyword search tool below to find specific information within the annual report.-
 1
1 -
2
-
3
-
4
-
5
-
6
-
7
-
8
-
9
-
10
-
11
-
12
-
13
-
14
-
15
-
16
-
17
-
18
-
19
-
20
-
21
-
22
-
23
-
24
-
25
-
26
-
27
-
28
-
29
-
30
-
31
-
32
-
33
-
34
-
35
-
36
-
37
-
38
-
 39
39 -
 40
40 -
 41
41 -
 42
42 -
 43
43 -
 44
44 -
 45
45 -
 46
46 -
 47
47 -
 48
48 -
 49
49 -
 50
50 -
 51
51 -
 52
52 -
 53
53 -
 54
54
 |
 |

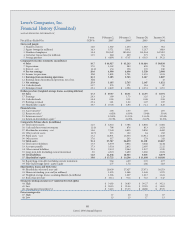
45
Lowe’s 2006 Annual Report
Earnings Statements
(In millions, except per share data) Fiscal 2006 Fiscal 2005
Quarter Ended 2/2/07 11/3/06 8/4/06 5/5/06 2/3/06* 10/28/05 7/29/05 4/29/05
Net sales $10,406 $11,211 $13,389 $11,921 $ 10,808 $ 10,592 $ 11,929 $ 9,913
Gross margin 3,687 3,865 4,478 4,169 3,785 3,580 4,027 3,398
Expenses:
SG&A 2,335 2,320 2,617 2,467 2,303 2,212 2,363 2,136
Store opening costs 49 44 28 25 57 35 25 25
Depreciation 308 297 283 274 261 246 236 237
Interest – net 43 45 30 35 36 36 39 47
Total expenses 2,735 2,706 2,958 2,801 2,657 2,529 2,663 2,445
Pre-tax earnings 952 1,159 1,520 1,368 1,128 1,051 1,364 953
Income tax provision 339 443 585 527 435 405 525 367
Net earnings 613 716 935 841 693 646 839 586
Basic earnings per share 0.40 0.47 0.61 0.54 0.44 0.41 0.54 0.38
Diluted earnings per share $ 0.40 $ 0.46 $ 0.60 $ 0.53 $ 0.43 $ 0.40 $ 0.52 $ 0.37
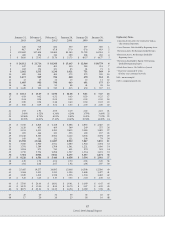
Earnings Statement Changes
(Changes from same quarter previous year, to nearest tenth percent)
Fiscal 2006 Fiscal 2005
Quarter Ended 2/2/07 11/3/06 8/4/06 5/5/06 2/3/06* 10/28/05 7/29/05 4/29/05
Net sales (3.7)% 5.8% 12.2% 20.3% 26.4% 16.9% 17.3% 14.2%
Gross margin (2.6) 8.0 11.2 22.7 27.1 18.0 19.1 19.2
Expenses:
SG&A 1.4 4.9 10.7 15.5 25.6 16.1 20.0 15.3
Store opening costs (14.0) 25.7 12.0 – 11.8 9.4 38.9 13.6
Depreciation 18.0 20.7 19.9 15.6 16.0 11.3 12.4 16.7
Interest – net 19.4 25.0 (23.1) (25.5) (16.3) (10.0) (13.3) (2.1)
Total expenses 2.9 7.0 11.1 14.6 23.4 15.0 18.8 15.0
Pre-tax earnings (15.6) 10.3 11.4 43.5 36.9 26.0 19.9 31.6
Income tax provision (22.1) 9.4 11.4 43.6 37.7 25.8 20.1 32.0
Net earnings (11.5) 10.8 11.4 43.5 36.4 26.2 19.7 31.4
Basic earnings per share (9.1) 14.6 13.0 42.1 33.3 24.2 20.0 35.7
Diluted earnings per share (7.0)% 15.0% 15.4% 43.2% 34.4% 25.0% 18.2% 37.0%
Earnings Statement Percentages
(Percent of sales to nearest hundredth;
income tax is percent of pre-tax earnings)
Fiscal 2006 Fiscal 2005
Quarter Ended 2/2/07 11/3/06 8/4/06 5/5/06 2/3/06* 10/28/05 7/29/05 4/29/05
Net sales 100.00% 100.00% 100.00% 100.00% 100.00% 100.00% 100.00% 100.00%
Gross margin 35.44 34.47 33.44 34.97 35.02 33.80 33.76 34.28
Expenses:
SG&A 22.44 20.70 19.54 20.69 21.31 20.88 19.81 21.55
Store opening costs 0.47 0.39 0.21 0.21 0.53 0.33 0.21 0.25
Depreciation 2.97 2.65 2.11 2.30 2.41 2.32 1.97 2.39
Interest – net 0.42 0.40 0.23 0.30 0.33 0.34 0.33 0.47
Total expenses 26.30 24.14 22.09 23.50 24.58 23.87 22.32 24.66
Pre-tax earnings 9.14 10.33 11.35 11.47 10.44 9.93 11.44 9.62
Income tax provision 35.57 38.20 38.51 38.49 38.50 38.50 38.50 38.50
Net earnings 5.89% 6.39% 6.98% 7.06% 6.42% 6.10% 7.03% 5.92%
* e fourth quarter of scal 2005 contained an additional week.
Lowe’s Companies, Inc.
Quarterly Review of Performance (Unaudited)