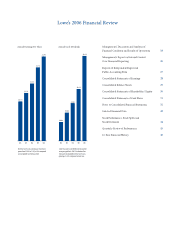
Lowe's 2006 Annual Report Download - page 27
Download and view the complete annual report
Please find page 27 of the 2006 Lowe's annual report below. You can navigate through the pages in the report by either clicking on the pages listed below, or by using the keyword search tool below to find specific information within the annual report.-
 1
1 -
2
-
3
-
4
-
5
-
6
-
7
-
8
-
9
-
10
-
11
-
12
-
13
-
14
-
15
-
16
-
 17
17 -
 18
18 -
 19
19 -
 20
20 -
 21
21 -
 22
22 -
 23
23 -
 24
24 -
 25
25 -
 26
26 -
 27
27 -
 28
28 -
 29
29 -
 30
30 -
 31
31 -
 32
32 -
 33
33 -
 34
34 -
 35
35 -
 36
36 -
 37
37 -
38
-
39
-
40
-
41
-
42
-
43
-
44
-
45
-
46
-
47
-
48
-
49
-
50
-
51
-
52
-
53
-
54
 |
 |

23
Lowe’s 2006 Annual Report
e appliance category delivered a double-digit comparable store sales
increase for 2005. According to independent measures, we increased our
unit market share in major appliances by 130 basis points for calendar
year 2005 versus calendar year 2004. Our success in appliances is a func-
tion of our brand selection and knowledgeable sales specialists. e
introduction of Samsung digital appliances in 2005 was evidence of our
commitment to enhance our brand selection and competitive oering.
We experienced a double-digit comparable store sales increase for
2005 in cabinets & countertops, which was driven by emphasis on our
product oering, as well as a focus on our Installed Sales initiative, which
plays a key role in driving cabinets & countertops sales.
Outdoor power equipment delivered a high single-digit comparable
store sales increase for the year. According to independent measures, we
increased our outdoor power equipment unit market share by 190 basis
points for calendar year 2005 versus calendar year 2004.
We also experienced comparable store sales increases in 18 of the 21
geographic regions. We continued to experience strong sales in Florida
and the Gulf Coast regions as customers repaired the damage caused by
the hurricanes in 2005 and 2004. We experienced comparable store sales
decreases in two Northeastern regions that had a slow, weather-aected
start in the rst quarter and never fully recovered. In addition, certain
areas of our North Central division suered from headline-making layos
and plant closings, which contributed to these decreases in comparable
store sales.
e growth in our Big 3 Specialty Sales initiatives also drove our sales
increase in 2005. Our focus on execution under our Installed Sales model
led to a 31% increase in Installed Sales over 2004. Our growth in 2005 was
driven by sales in cabinets & countertops, ooring and millwork. Special
Order Sales increased 25% over 2004. Finally, we experienced signicant
sales growth from Commercial Business Customers. Strengthening cus-
tomer relationships, supported by targeted marketing and market-specic
merchandising assortments, continued to drive this part of our business.
Gross margin
For 2005, gross margin of 34.20% represented a 64-basis-point increase
over 2004. Approximately 40 basis points of the increase in gross margin
as a percentage of sales for 2005 was due to the impact of the implemen-
tation of EITF 02-16 as it related to cooperative advertising and in-store
services, which reduced gross margin in 2004 as these funds were capital-
ized into inventory and recognized in income when the product was sold.
e increase in 2005 gross margin was also driven by growth in imported
goods, improvements in inventory shrink and a positive sales mix.
SG&A
e increase in SG&A expenses as a percentage of sales from 2004 to
2005 was primarily due to increased 401(k) performance match contri-
butions as a percentage of sales resulting from our increased protability
in 2005. In addition, there were increases as a percentage of sales in store
remerchandising expense, which resulted from our continued invest-
ment in existing stores, and rent expense, as we continue to expand into
metropolitan markets. ese increases were partially oset by a decrease
in vendor-provided store-service costs as a percentage of sales. Our
ongoing evaluation of in-store vendor service expense allowed us to
appropriately adjust the level of vendor service in our stores, which led to
the decrease as a percentage of sales. In addition, although there was an
increase in advertising expense compared to 2004, we were able to enhance
messaging and rene our marketing mix to make our advertising programs
more productive, thereby resulting in the leverage of advertising expense
as a percentage of sales in 2005.
Store opening costs
Store opening costs totaled $142 million in 2005 compared to $123 million
in 2004. ese costs are associated with the opening of 150 stores in 2005
(147 new and three relocated), as compared with the opening of 140 stores
in 2004 (136 new and four relocated). Store opening costs for stores opened
during the year averaged approximately $0.9 million per store in 2005 and
2004. Because store opening costs are expensed as incurred, the timing of
expense recognition may uctuate based on the timing of store openings.
Depreciation
Depreciation leveraged eight basis points as a percentage of sales in 2005.
At February 3, 2006, we owned 84% of our stores, compared to 81% at
January 28, 2005, which includes stores on leased land. Property, less accu-
mulated depreciation, increased to $16.4 billion at February 3, 2006, com-
pared to $13.9 billion at January 28, 2005. e increase in property
resulted primarily from our store expansion program and an additional
investment in information technology.
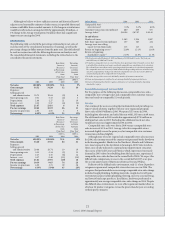
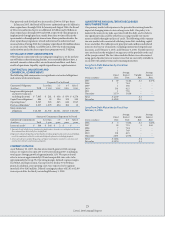
Interest
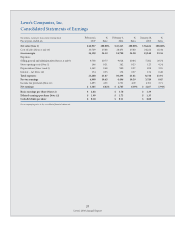
Net interest expense was comprised of the following:
(In millions) 2005 2004
Interest expense, net of amount capitalized $186 $172
Amortization of original issue discount and loan costs 17 20
Interest income (45) (16)
Net interest expense $158 $176
Interest expense increased primarily due to the October 2005 $1 billion
debt issuance, partially oset by lower interest expense on convertible debt
due to conversions during 2005. Interest expense relating to capital leases was
$39 million for 2005 and $38 million for 2004. Interest income increased
primarily due to the investment of a portion of the proceeds from the
October 2005 $1 billion debt issuance.
Income tax provision
Our eective income tax rate was 38.5% in 2005 and 2004.
FINANCIAL CONDITION, LIQUIDITY AND CAPITAL RESOURCES
We believe in our potential for long-term growth and protability, and
while we are focused on growing sales and earnings, we are also focused
on cash ow. By making working capital improvements, we expect cash
ow from operations to grow faster than earnings. Our long-term goal
is to grow inventory at 75% of sales growth. Our largest initiative over
the past couple of years was R3, which encompassed numerous supply
chain enhancements that would allow us to more eectively and eciently
move product to our stores in changing demand environments. at
platform is rmly in place and is now our standard operating model.
In 2006, sales increased 8.5%, while inventory growth was 7.7%. e
increase in our inventory balance from 2005 to 2006 was the result of
new or non-comparable stores. Both comparable stores and distribution
center inventories were down slightly versus the prior year. In addition,
we are focused on improving working capital through increased days
payable outstanding.