Lowe's 2006 Annual Report Download - page 26
Download and view the complete annual report
Please find page 26 of the 2006 Lowe's annual report below. You can navigate through the pages in the report by either clicking on the pages listed below, or by using the keyword search tool below to find specific information within the annual report.-
 1
1 -
2
-
3
-
4
-
5
-
6
-
7
-
8
-
9
-
10
-
11
-
12
-
13
-
14
-
15
-
 16
16 -
 17
17 -
 18
18 -
 19
19 -
 20
20 -
 21
21 -
 22
22 -
 23
23 -
 24
24 -
 25
25 -
 26
26 -
 27
27 -
 28
28 -
 29
29 -
 30
30 -
 31
31 -
 32
32 -
 33
33 -
 34
34 -
 35
35 -
 36
36 -
37
-
38
-
39
-
40
-
41
-
42
-
43
-
44
-
45
-
46
-
47
-
48
-
49
-
50
-
51
-
52
-
53
-
54
 |
 |

22
Lowe’s 2006 Annual Report
Outdoor power equipment and lumber experienced the greatest
comparable store sales declines in 2006. Comparable store generator sales
were down 34% for the year, compared to strong sales driven by the 2005
hurricanes. Additionally, a warmer than normal winter led to comparable
store sales declines for snow throwers. However, despite the dicult sales
environment, we experienced a 2% unit market share gain in outdoor
power equipment in calendar year 2006. Lumber and plywood experienced
more than 15% cost deation and similar retail price deation in 2006.
Our Big 3 Specialty Sales initiatives had mixed results in 2006. A
hesitation to take on large projects by some consumers had an impact
on our Installed Sales and Special Order Sales in the second half of 2006.
Installed Sales increased 9% over 2005. Our Installed Sales consist of both
stock and special order product for which we arrange installation for our
customers. Special Order Sales increased 5% over 2005. In contrast, sales
growth for Commercial Business Customers was nearly double the
Company average.
Gross margin
For 2006, gross margin of 34.52% represented a 32-basis-point increase
over 2005. is increase as a percentage of sales was primarily due to
positive product mix shis and a greater proportion of imported goods,
which typically have lower acquisition costs. For 2006, we imported
approximately 11% of our goods compared to approximately 9.5% in the
prior year. ese items were slightly oset by higher inventory shrink as
a percentage of sales.
SG&A
e decrease in SG&A as a percentage of sales from 2005 to 2006 was
primarily due to lower expenses related to bonus and retirement plans.
Our performance-based bonus and retirement expenses uctuate with
our sales and earnings performance relative to plan, and decreased approxi-
mately $200 million or 50 basis points in 2006. In addition, insurance
expense leveraged 12 basis points in 2006, a result of our ongoing safety
initiatives and the benets of regulatory changes in certain states, which
contributed to actuarial projections of lower costs to settle claims. ese
items were partially oset by de-leverage in store payroll. As sales slowed
throughout the year, our stores adjusted their hours accordingly. However,
because of our base stang requirements and customer service standards,
we chose not to reduce payroll at the same rate as sales.
Store opening costs
Store opening costs, which include payroll and supply costs incurred prior
to store opening as well as grand opening advertising costs, totaled $146
million in 2006 compared to $142 million in 2005. ese costs are associ-
ated with the opening of 155 stores in 2006 (151 new and four relocated),
as compared with the opening of 150 stores in 2005 (147 new and three
relocated). Store opening costs for stores opened during the year averaged
approximately $0.9 million per store in 2006 and 2005. Because store
opening costs are expensed as incurred, the timing of expense recognition
uctuates based on the timing of store openings.
Depreciation
Depreciation de-leveraged 21 basis points as a percentage of sales in 2006.
is de-leverage was driven by growth in assets and the soer sales envi-
ronment. At February 2, 2007, we owned 86% of our stores, compared to
84% at February 3, 2006, which includes stores on leased land. Property,
less accumulated depreciation, increased to $19.0 billion at February 2,
2007, compared to $16.4 billion at February 3, 2006. e increase in prop-
erty resulted primarily from our store expansion program as well as our
remerchandising eorts.
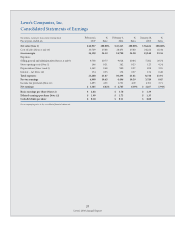
Interest
Net interest expense is comprised of the following:
(In millions) 2006 2005
Interest expense, net of amount capitalized $200 $186
Amortization of original issue discount and loan costs 6 17
Interest income (52) (45)
Net interest expense $154 $158
Interest expense increased primarily due to the October 2006 $1 billion
debt issuance, partially oset by lower interest expense on convertible debt
due to conversions during 2006. Interest expense relating to capital leases
was $34 million for 2006 and $39 million for 2005. Amortization of loan
costs decreased in 2006 versus the prior year as a result of increased
debt conversions.
Income tax provision
Our eective income tax rate was 37.9% in 2006 versus 38.5% in 2005.
e decrease in the eective tax rate was the result of increased federal
tax credits associated with Welfare to Work and Work Opportunity Tax
Credit programs and increased state tax credits related to our investments
in employees and property.
Fiscal 2005 Compared to Fiscal 2004
For the purpose of the following discussion, comparable store sales,
comparable store average ticket and comparable store customer transac-
tions are based on comparable 53-week periods.
Net sales
Comparable store sales, our ongoing store expansion and relocation
program and continued growth in our Specialty Sales initiatives were
key drivers of our sales increase in 2005. We opened 150 stores in 2005,
including three relocations, and ended the year with stores in 49 states,
including our rst stores in New Hampshire. e additional week in
2005 resulted in approximately $750 million in sales and impacted 2005
sales growth by about 2.1%.
e comparable store sales increase of 6.1% in 2005 was on top of com-
parable store sales increases of 6.6% in 2004 and 6.7% in 2003. e comparable
store sales increase in 2005 was driven by increases in both average ticket
and transactions. Average ticket for comparable stores increased 6.1% and
comparable store customer transactions increased slightly.
We experienced comparable store sales increases in every product
category for 2005. e categories that performed above our average com-
parable store sales increase for 2005 included millwork, rough plumbing,
building materials, rough electrical, outdoor power equipment, appliances,
home environment, paint, ooring and cabinets & countertops. In addition,
hardware and fashion plumbing performed at approximately the average
comparable store sales increase. Ination in lumber and building materials
favorably impacted comparable store sales for 2005 by approximately 50
basis points, driven by gypsum, roong and cement products. We also
continued to gain market share in key product categories previously dom-
inated by other channels, including appliances, outdoor power equipment
and cabinets & countertops.