Lowe's 2006 Annual Report Download - page 25
Download and view the complete annual report
Please find page 25 of the 2006 Lowe's annual report below. You can navigate through the pages in the report by either clicking on the pages listed below, or by using the keyword search tool below to find specific information within the annual report.-
 1
1 -
2
-
3
-
4
-
5
-
6
-
7
-
8
-
9
-
10
-
11
-
12
-
13
-
14
-
 15
15 -
 16
16 -
 17
17 -
 18
18 -
 19
19 -
 20
20 -
 21
21 -
 22
22 -
 23
23 -
 24
24 -
 25
25 -
 26
26 -
 27
27 -
 28
28 -
 29
29 -
 30
30 -
 31
31 -
 32
32 -
 33
33 -
 34
34 -
 35
35 -
36
-
37
-
38
-
39
-
40
-
41
-
42
-
43
-
44
-
45
-
46
-
47
-
48
-
49
-
50
-
51
-
52
-
53
-
54
 |
 |

21
Lowe’s 2006 Annual Report
Although we believe we have sucient current and historical knowl-
edge to record reasonable estimates of sales returns, it is possible that actual
returns could dier from recorded amounts. A 1% change in actual returns
would have aected net earnings for 2006 by approximately $3 million. A
1% change in the average return period would not have had a signicant
impact on net earnings for 2006.
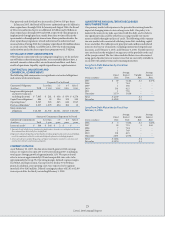
OPERATIONS
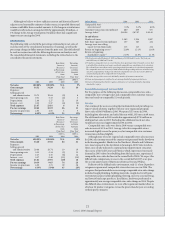
e following table sets forth the percentage relationship to net sales of
each line item of the consolidated statements of earnings, as well as the
percentage change in dollar amounts from the prior year. is table should
be read in conjunction with the following discussion and analysis and
the consolidated nancial statements, including the related notes to the
consolidated nancial statements.
Basis Point Percentage
Increase/ Increase/
(Decrease) (Decrease)
in Percentage in Dollar
of Net Sales Amounts
from from
Prior Year
1
Prior Year
1
2006 vs. 2006 vs.
2006 2005 2005 2005
Net sales 100.00% 100.00% N/A 9%
Gross margin 34.52 34.20 32 10
Expenses:
Selling, general
and administrative 20.75 20.84 (9) 8
Store opening costs 0.31 0.33 (2) 3
Depreciation 2.48 2.27 21 19
Interest – net 0.33 0.37 (4) (3)
Total expenses 23.87 23.81 6 9
Pre-tax earnings 10.65 10.39 26 11
Income tax provision 4.03 4.00 3 9
Net earnings 6.62% 6.39% 23 12%
Basis Point Percentage
Increase/ Increase/
(Decrease) (Decrease)
in Percentage in Dollar
of Net Sales Amounts
from from
Prior Year
1
Prior Year
1
2005 vs. 2005 vs.
2005 2004 2004 2004
Net sales 100.00% 100.00% N/A 19%
Gross margin 34.20 33.56 64 21
Expenses:
Selling, general
and administrative 20.84 20.74 10 19
Store opening costs 0.33 0.34 (1) 15
Depreciation 2.27 2.35 (8) 14
Interest – net 0.37 0.48 (11) (10)
Total expenses 23.81 23.91 (10) 18
Pre-tax earnings 10.39 9.65 74 28
Income tax provision 4.00 3.71 29 28
Net earnings 6.39% 5.94% 45 28%
Other Metrics 2006 2005 2004
Comparable store
sales increases2 0.0% 6.1% 6.6%
Customer transactions (in millions)
1
680 639 575
Average ticket1,3 $ 68.98 $ 67.67 $ 63.43
At end of year:
Number of stores 1,385 1,234 1,087
Sales oor square feet (in millions) 157 140 124
Average store size selling
square feet (in thousands) 113 113 114
Return on beginning assets1,4 12.6% 13.1% 11.6%
Return on beginning
shareholders’ equity
1,5
21.7% 24.0% 21.3%
1 e scal years ended February 2, 2007 and January 28, 2005 had 52 weeks. e scal year
ended February 3, 2006 had 53 weeks.
2 We dene a comparable store as a store that has been open longer than 13 months. A store that
is identied for relocation is no longer considered comparable one month prior to its relocation.
e relocated store must then remain open longer than 13 months to be considered comparable.
e comparable store sales increase for 2006 included in the preceding table was calculated using
sales for a comparable 52-week period, while the comparable store sales increase for 2005 was
calculated using sales for a comparable 53-week period.
3 We dene average ticket as net sales divided by number of customer transactions.
4 Return on beginning assets is dened as net earnings divided by beginning total assets.
5 Return on beginning shareholders’ equity is dened as net earnings divided by beginning
shareholders’ equity.
Fiscal 2006 Compared to Fiscal 2005
For the purpose of the following discussion, comparable store sales,
comparable store average ticket and comparable store customer transac-
tions are based on comparable 52-week periods.
Net sales
Our continued focus on executing the fundamentals and providing cus-
tomer-valued solutions together with our store expansion program
drove sales of $46.9 billion in 2006. We opened 155 stores in 2006,
including four relocations, and ended the year with 1,385 stores in 49 states.
e additional week in 2005 resulted in approximately $750 million in
additional net sales in 2005. Excluding the additional week, net sales
would have increased approximately 10% in 2006.
Comparable store sales were at in 2006 versus a comparable store
sales increase of 6.1% in 2005. Average ticket for comparable stores
increased slightly versus the prior year, but comparable store customer
transactions declined slightly.
Although nine of our 21 regions had comparable store sales increases
for 2006, sales in many areas of the country were pressured by the slowdown
in the housing market. Markets in the Northeast, Florida and California
were most exposed to the slowdown in housing in 2006. Sales trends in
those areas clearly indicated a cautious home improvement consumer.
Also, areas of the Gulf Coast and Florida, which experienced increased
demand in 2005 related to rebuilding from the hurricanes, experienced
comparable store sales declines in the second half of 2006. We expect the
dicult sales comparisons to ease in the second half of 2007 as we pass
the second anniversary of Hurricanes Katrina, Rita and Wilma.
Reective of the dicult sales environment, only 11 of our 20 product
categories experienced comparable store sales increases in 2006. e
categories that performed above our average comparable store sales change
included rough plumbing, building materials, rough electrical, home
environment, paint, fashion plumbing, ooring, nursery, seasonal living,
and lawn & landscape products. In addition, hardware performed at
approximately our average comparable store sales change in 2006. Despite
the dicult sales environment, we were able to gain unit market share in
all of our 20 product categories versus the prior calendar year, according
to third-party estimates.