Lowe's 2006 Annual Report Download - page 47
Download and view the complete annual report
Please find page 47 of the 2006 Lowe's annual report below. You can navigate through the pages in the report by either clicking on the pages listed below, or by using the keyword search tool below to find specific information within the annual report.-
 1
1 -
2
-
3
-
4
-
5
-
6
-
7
-
8
-
9
-
10
-
11
-
12
-
13
-
14
-
15
-
16
-
17
-
18
-
19
-
20
-
21
-
22
-
23
-
24
-
25
-
26
-
27
-
28
-
29
-
30
-
31
-
32
-
33
-
34
-
35
-
36
-
 37
37 -
 38
38 -
 39
39 -
 40
40 -
 41
41 -
 42
42 -
 43
43 -
 44
44 -
 45
45 -
 46
46 -
 47
47 -
 48
48 -
 49
49 -
 50
50 -
 51
51 -
 52
52 -
 53
53 -
 54
54
 |
 |

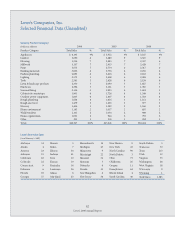
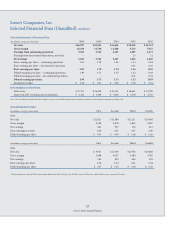
Selected Statement of Earnings Data:
(In millions, except per share data) 2006 2005* 2004 2003 2002
Net sales $ 46,927 $ 43,243 $ 36,464 $ 30,838 $ 26,112
Gross margin 16,198 14,790 12,240 9,533 7,915
Earnings from continuing operations 3,105 2,765 2,167 1,807 1,473
Earnings from discontinued operations, net of tax – – – 15 12
Net earnings 3,105 2,765 2,167 1,822 1,485
Basic earnings per share – continuing operations 2.02 1.78 1.39 1.15 0.94
Basic earnings per share – discontinued operations – – – 0.01 0.01
Basic earnings per share 2.02 1.78 1.39 1.16 0.95
Diluted earnings per share – continuing operations 1.99 1.73 1.35 1.12 0.92
Diluted earnings per share – discontinued operations – – – 0.01 0.01
Diluted earnings per share 1.99 1.73 1.35 1.13 0.93
Dividends per share $ 0.18 $ 0.11 $ 0.08 $ 0.06 $ 0.04
Selected Balance Sheet Data:
Total assets $ 27,767 $ 24,639 $ 21,101 $ 18,667 $ 15,790
Long-term debt, excluding current maturities $ 4,325 $ 3,499 $ 3,060 $ 3,678 $ 3,736
Note: e selected nancial data has been adjusted to present the 2003 disposal of the Contractor Yards as a discontinued operation for all periods.
Selected Quarterly Data:
(In millions, except per share data) First Second ird Fourth
2006
Net sales $ 11,921 $ 13,389 $ 11,211 $ 10,406
Gross margin 4,169 4,478 3,865 3,687
Net earnings 841 935 716 613
Basic earnings per share 0.54 0.61 0.47 0.40
Diluted earnings per share $ 0.53 $ 0.60 $ 0.46 $ 0.40
(In millions, except per share data) First Second ird Fourth*
2005
Net sales $ 9,913 $ 11,929 $ 10,592 $ 10,808
Gross margin 3,398 4,027 3,580 3,785
Net earnings 586 839 646 693
Basic earnings per share 0.38 0.54 0.41 0.44
Diluted earnings per share $ 0.37 $ 0.52 $ 0.40 $ 0.43
* e fourth quarter of scal 2005 contained an additional week. erefore, scal 2005 contained 53 weeks, while all other years contained 52 weeks.
43
Lowe’s 2006 Annual Report
Lowe’s Companies, Inc.
Selected Financial Data (Unaudited) continued