McDonalds 2011 Annual Report Download - page 12
Download and view the complete annual report
Please find page 12 of the 2011 McDonalds annual report below. You can navigate through the pages in the report by either clicking on the pages listed below, or by using the keyword search tool below to find specific information within the annual report.-
 1
1 -
 2
2 -
 3
3 -
 4
4 -
 5
5 -
 6
6 -
 7
7 -
 8
8 -
 9
9 -
 10
10 -
 11
11 -
 12
12 -
 13
13 -
 14
14 -
 15
15 -
 16
16 -
 17
17 -
 18
18 -
 19
19 -
 20
20 -
 21
21 -
 22
22 -
23
-
24
-
25
-
26
-
27
-
28
-
29
-
30
-
31
-
32
-
33
-
34
-
35
-
36
-
37
-
38
-
39
-
40
-
41
-
42
-
43
-
44
-
45
-
46
-
47
-
48
-
49
-
50
-
51
-
52
 |
 |
(denominator), primarily capital expenditures. The calculation
uses a constant average foreign exchange rate over the peri-
ods included in the calculation.
STRATEGIC DIRECTION AND FINANCIAL PERFORMANCE
The strength of the alignment between the Company, its franchi-
sees and suppliers (collectively referred to as the System) has
been key to McDonald’s success. This business model enables
McDonald’s to consistently deliver locally-relevant restaurant
experiences to customers and be an integral part of the commun-
ities we serve. In addition, it facilitates our ability to identify,
implement and scale innovative ideas that meet customers’
changing needs and preferences.
McDonald’s customer-focused Plan to Win—which concen-
trates on being better, not just bigger—provides a common
framework for our global business while allowing for local
adaptation. Through the execution of multiple initiatives surround-
ing the five elements of our Plan to Win—People, Products,
Place, Price and Promotion—we have enhanced the restaurant
experience for customers worldwide and grown comparable
sales and customer visits in each of the last eight years. This
Plan, combined with financial discipline, has delivered strong
results for our shareholders.
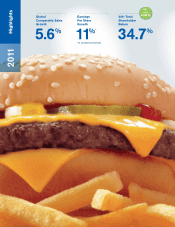
We have exceeded our long-term, constant currency financial
targets of average annual Systemwide sales growth of 3% to
5%; average annual operating income growth of 6% to 7%; and
annual returns on incremental invested capital in the high teens
every year since the Plan’s implementation in 2003, after adjust-
ing for the loss in 2007 from the Latin America developmental
license transaction. Given the size and scope of our global busi-
ness, we believe these financial targets are realistic and
sustainable over time, keeping us focused on making the best
decisions for the long-term benefit of our System.
In 2011, we remained focused on customers’ needs and
accelerated efforts within the Plan to Win where the greatest
opportunity exists. The Company’s key global priorities of optimiz-
ing our menu, modernizing the customer experience, and
broadening accessibility to our Brand represent areas where we
are intensifying our efforts to drive the business further. Initiatives
supporting these priorities resonated with consumers, driving
increases in sales and customer visits despite challenging
economies and a contracting Informal Eating Out (IEO) segment
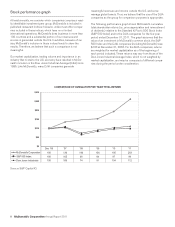
in many markets. As a result, every area of the world contributed
to 2011 global comparable sales and guest counts increasing
5.6% and 3.7%, respectively.
Specific menu pricing actions across our system reflect local
market conditions as well as other factors, notably the food away
from home and food at home inflation indices. In our Company-
operated restaurants, we manage menu board prices to ensure
value at all price points, increase profitability and mitigate
inflation, all while trying to maintain guest count momentum. In
order to accomplish these objectives, we utilize a strategic pricing
tool that balances price, product mix and promotion. Franchisees
also have access to, and many utilize, this strategic pricing tool. In
general, we believe franchisees employ a similar pricing strategy.
In 2011, we increased average price at Company-operated res-
taurants in each area of the world, although increases varied by
market and region. We look to optimize product mix by utilizing a
menu with entry-point value, core, premium and fourth-tier offer-
ings. We also introduce new products that meet customer needs,
which can expand average check and increase guest counts.
In the U.S., we grew sales, guest counts and market share
with comparable sales up for the ninth consecutive year, rising
4.8% in 2011, while comparable guest counts rose 3.3%. These
results were achieved despite a slight decline in the IEO seg-
ment. We remained focused on maximizing our core business
while providing customers with affordable products and value
throughout our menu including options available on the Dollar
Menu at breakfast and the rest of the day. We highlighted core
menu items like Chicken McNuggets that featured new sauces,
breakfast products including our new Fruit & Maple Oatmeal,
additions to the McCafé beverage line and limited-time offerings
such as the McRib sandwich. The national launch of the McCafé
Frozen Strawberry Lemonade and Mango Pineapple real-fruit
smoothie provided meaningful extensions to the McCafé bever-
age line. Convenient locations also continued to provide a
competitive advantage with extended hours and efficient drive-
thru service. Modernizing the customer experience remained a
focus with the expansion of our major remodeling program to
enhance the appearance and functionality of our restaurants and
make our restaurants more relevant to our customers’ daily lives.
Over 900 existing restaurants were remodeled during 2011 with
the majority adding drive-thru capacity to capture additional guest
counts. We also completed our two-year, Systemwide roll-out of a
new point-of-sale system. This allows us to continue expanding
our menu offerings while making it easier for our crew to fulfill
every order accurately.
In Europe, comparable sales rose 5.9%, marking the eighth
consecutive year of comparable sales increases, and comparable
guest counts rose 3.4%. Major contributors were the U.K., France,
Russia and Germany. Initiatives that helped drive our business
included leveraging our tiered menu featuring everyday affordable
prices, menu variety including new and limited-time offerings, and
reimaging over 900 restaurants. We continue to expand our cof-
fee business and have over 1,500 McCafé locations, which in
Europe are generally separate areas inside the restaurants that
serve specialty coffees, indulgent desserts and snacks. We com-
pleted the rollout of the new drive-thru customer order display
system in over 4,500 restaurants. In addition, we increased our
accessibility and convenience with extended operating hours. We
offered new premium menu items such as the 1955 burger and
expanded McWraps across several European markets. In many
markets, we have continued to offer a fourth-tier platform—such
as Little Tasters in the U.K.—a range of tasty and appealing items
in smaller portion sizes. Finally, we continued building customer
trust in our brand through communications that emphasized the
quality and origin of McDonald’s food and our commitment to
sustainable business practices.
In APMEA, our momentum continued with nearly every coun-
try delivering positive comparable sales, led by China and
Australia. Comparable sales rose 4.7% and comparable guest
counts rose 4.3% with performance driven by strategies empha-
sizing value, breakfast, convenience, core menu extensions,
desserts and promotional food events. Australia launched a Value
Lunch program that features meals at discounted price points for
certain hours while China and Japan concentrated on afford-
ability by continuing their Value Lunch platforms. New menu
items such as real-fruit smoothies and frappés in Australia and
the extension of the Value Breakfast program in China were
popular with customers. Japan executed another successful U.S.
themed burger promotion and celebrated its 40th anniversary by
offering popular core menu items at reduced prices. Desserts
10 McDonald’s Corporation Annual Report 2011