McDonalds 2011 Annual Report Download - page 38
Download and view the complete annual report
Please find page 38 of the 2011 McDonalds annual report below. You can navigate through the pages in the report by either clicking on the pages listed below, or by using the keyword search tool below to find specific information within the annual report.-
 1
1 -
2
-
3
-
4
-
5
-
6
-
7
-
8
-
9
-
10
-
11
-
12
-
13
-
14
-
15
-
16
-
17
-
18
-
19
-
20
-
21
-
22
-
23
-
24
-
25
-
26
-
27
-
 28
28 -
 29
29 -
 30
30 -
 31
31 -
 32
32 -
 33
33 -
 34
34 -
 35
35 -
 36
36 -
 37
37 -
 38
38 -
 39
39 -
 40
40 -
 41
41 -
 42
42 -
 43
43 -
 44
44 -
 45
45 -
 46
46 -
 47
47 -
 48
48 -
49
-
50
-
51
-
52
 |
 |

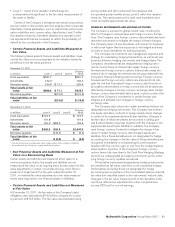
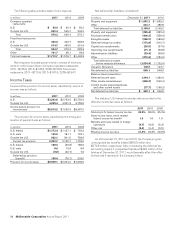
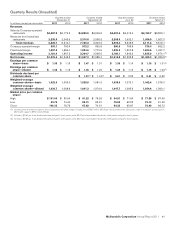
The following table provides detail of rent expense:
In millions 2011 2010 2009
Company-operated
restaurants:
U.S. $ 55.9 $ 60.4 $ 65.2
Outside the U.S. 620.4 545.0 506.9
Total 676.3 605.4 572.1
Franchised restaurants:
U.S. 420.0 409.7 393.9
Outside the U.S. 514.7 463.5 431.4
Total 934.7 873.2 825.3
Other 101.7 98.1 98.9
Total rent expense $1,712.7 $1,576.7 $1,496.3
Rent expense included percent rents in excess of minimum
rents (in millions) as follows–Company-operated restaurants:
2011–$165.2; 2010–$142.5; 2009–$129.6. Franchised
restaurants: 2011–$173.4; 2010–$167.3; 2009–$154.7.
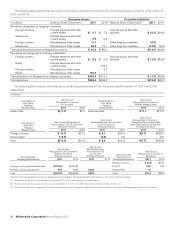
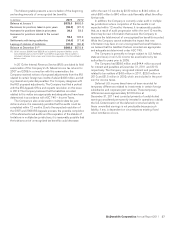
Income Taxes
Income before provision for income taxes, classified by source of
income, was as follows:
In millions 2011 2010 2009
U.S. $3,202.8 $2,763.0 $2,700.4
Outside the U.S. 4,809.4 4,237.3 3,786.6
Income before provision for
income taxes $8,012.2 $7,000.3 $6,487.0
The provision for income taxes, classified by the timing and
location of payment, was as follows:
In millions 2011 2010 2009
U.S. federal $1,173.4 $1,127.1 $ 792.0
U.S. state 165.2 161.1 152.1
Outside the U.S. 982.1 841.5 788.9
Current tax provision 2,320.7 2,129.7 1,733.0
U.S. federal 189.0 (66.8) 186.9
U.S. state 8.6 13.8 8.6
Outside the U.S. (9.2) (22.7) 7.5
Deferred tax provision
(benefit) 188.4 (75.7) 203.0
Provision for income taxes $2,509.1 $2,054.0 $1,936.0
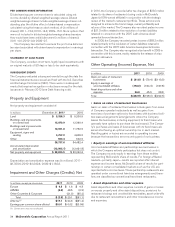
Net deferred tax liabilities consisted of:
In millions December 31, 2011 2010
Property and equipment $ 1,651.3 $ 1,655.2
Other 541.7 489.8
Total deferred tax liabilities 2,193.0 2,145.0
Property and equipment (355.4) (352.4)
Employee benefit plans (406.3) (356.4)
Intangible assets (256.2) (268.6)
Deferred foreign tax credits (173.9) (310.7)
Capital loss carryforwards (26.0) (37.5)
Operating loss carryforwards (71.1) (56.8)
Indemnification liabilities (33.4) (36.5)
Other (312.6) (284.0)
Total deferred tax assets
before valuation allowance (1,634.9) (1,702.9)
Valuation Allowance 102.0 104.7
Net deferred tax liabilities 660.1 546.8
Balance sheet presentation:
Deferred income taxes 1,344.1 1,332.4
Other assets-miscellaneous (606.3) (590.4)
Current assets-prepaid expenses
and other current assets (77.7) (195.2)
Net deferred tax liabilities $ 660.1 $ 546.8
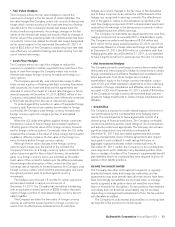
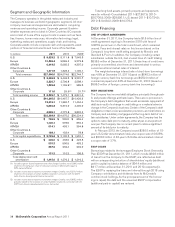
The statutory U.S. federal income tax rate reconciles to the
effective income tax rates as follows:
2011 2010 2009
Statutory U.S. federal income tax rate 35.0% 35.0% 35.0%
State income taxes, net of related
federal income tax benefit 1.4 1.6 1.6
Benefits and taxes related to foreign
operations (4.7) (6.9) (6.3)
Other, net (0.4) (0.4) (0.5)
Effective income tax rates 31.3% 29.3% 29.8%
As of December 31, 2011 and 2010, the Company’s gross
unrecognized tax benefits totaled $565.0 million and
$572.6 million, respectively. After considering the deferred tax
accounting impact, it is expected that about $420 million of the
total as of December 31, 2011 would favorably affect the effec-
tive tax rate if resolved in the Company’s favor.
36 McDonald’s Corporation Annual Report 2011