McDonalds 2011 Annual Report Download - page 29
Download and view the complete annual report
Please find page 29 of the 2011 McDonalds annual report below. You can navigate through the pages in the report by either clicking on the pages listed below, or by using the keyword search tool below to find specific information within the annual report.-
 1
1 -
2
-
3
-
4
-
5
-
6
-
7
-
8
-
9
-
10
-
11
-
12
-
13
-
14
-
15
-
16
-
17
-
18
-
 19
19 -
 20
20 -
 21
21 -
 22
22 -
 23
23 -
 24
24 -
 25
25 -
 26
26 -
 27
27 -
 28
28 -
 29
29 -
 30
30 -
 31
31 -
 32
32 -
 33
33 -
 34
34 -
 35
35 -
 36
36 -
 37
37 -
 38
38 -
 39
39 -
40
-
41
-
42
-
43
-
44
-
45
-
46
-
47
-
48
-
49
-
50
-
51
-
52
 |
 |

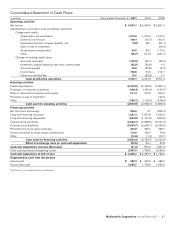
Consolidated Statement of Cash Flows
In millions Years ended December 31, 2011 2010 2009
Operating activities
Net income $ 5,503.1 $ 4,946.3 $ 4,551.0
Adjustments to reconcile to cash provided by operations
Charges and credits:
Depreciation and amortization 1,415.0 1,276.2 1,216.2
Deferred income taxes 188.4 (75.7) 203.0
Impairment and other charges (credits), net (3.9) 29.1 (61.1)
Gain on sale of investment (94.9)
Share-based compensation 86.2 83.1 112.9
Other (78.7) 211.6 (347.1)
Changes in working capital items:
Accounts receivable (160.8) (50.1) (42.0)
Inventories, prepaid expenses and other current assets (52.2) (50.8) 1.0
Accounts payable 35.8 (39.8) (2.2)
Income taxes 198.5 54.9 212.1
Other accrued liabilities 18.7 (43.2) 2.1
Cash provided by operations 7,150.1 6,341.6 5,751.0
Investing activities
Capital expenditures (2,729.8) (2,135.5) (1,952.1)
Purchases of restaurant businesses (186.4) (183.4) (145.7)
Sales of restaurant businesses and property 511.4 377.9 406.0
Proceeds on sale of investment 144.9
Other (166.1) (115.0) (108.4)
Cash used for investing activities (2,570.9) (2,056.0) (1,655.3)
Financing activities
Net short-term borrowings 260.6 3.1 (285.4)
Long-term financing issuances 1,367.3 1,931.8 1,169.3
Long-term financing repayments (624.0) (1,147.5) (664.6)
Treasury stock purchases (3,363.1) (2,698.5) (2,797.4)
Common stock dividends (2,609.7) (2,408.1) (2,235.5)
Proceeds from stock option exercises 334.0 463.1 332.1
Excess tax benefit on share-based compensation 112.5 128.7 73.6
Other (10.6) (1.3) (13.1)
Cash used for financing activities (4,533.0) (3,728.7) (4,421.0)
Effect of exchange rates on cash and equivalents (97.5) 34.1 57.9
Cash and equivalents increase (decrease) (51.3) 591.0 (267.4)
Cash and equivalents at beginning of year 2,387.0 1,796.0 2,063.4
Cash and equivalents at end of year $ 2,335.7 $ 2,387.0 $ 1,796.0
Supplemental cash flow disclosures
Interest paid $ 489.3 $ 457.9 $ 468.7
Income taxes paid 2,056.7 1,708.5 1,683.5
See Notes to consolidated financial statements.
McDonald’s Corporation Annual Report 2011 27