McDonalds 2011 Annual Report Download - page 17
Download and view the complete annual report
Please find page 17 of the 2011 McDonalds annual report below. You can navigate through the pages in the report by either clicking on the pages listed below, or by using the keyword search tool below to find specific information within the annual report.-
 1
1 -
2
-
3
-
4
-
5
-
6
-
 7
7 -
 8
8 -
 9
9 -
 10
10 -
 11
11 -
 12
12 -
 13
13 -
 14
14 -
 15
15 -
 16
16 -
 17
17 -
 18
18 -
 19
19 -
 20
20 -
 21
21 -
 22
22 -
 23
23 -
 24
24 -
 25
25 -
 26
26 -
 27
27 -
28
-
29
-
30
-
31
-
32
-
33
-
34
-
35
-
36
-
37
-
38
-
39
-
40
-
41
-
42
-
43
-
44
-
45
-
46
-
47
-
48
-
49
-
50
-
51
-
52
 |
 |

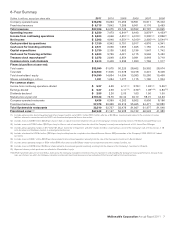
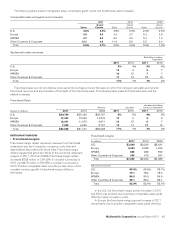
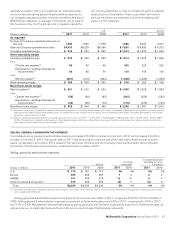
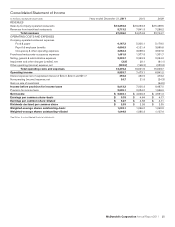
The following tables present comparable sales, comparable guest counts and Systemwide sales increases:
Comparable sales and guest count increases
2011 2010 2009
Sales
Guest
Counts Sales Guest
Counts Sales Guest
Counts
U.S. 4.8% 3.3% 3.8% 5.3% 2.6% 0.5%
Europe 5.9 3.4 4.4 2.7 5.2 2.8
APMEA 4.7 4.3 6.0 4.9 3.4 1.4
Other Countries & Corporate 10.1 4.5 11.3 8.3 5.5 2.4
Total 5.6% 3.7% 5.0% 4.9% 3.8% 1.4%
Systemwide sales increases
Excluding currency
translation
2011 2010 2011 2010
U.S. 5% 4% 5% 4%
Europe 14 397
APMEA 16 15 77
Other Countries & Corporate 17 13 12 13
Total 11% 7% 7% 6%
Franchised sales are not recorded as revenues by the Company, but are the basis on which the Company calculates and records
franchised revenues and are indicative of the health of the franchisee base. The following table presents Franchised sales and the
related increases:
Franchised Sales
Amount Increase Increase excluding
currency translation
Dollars in millions 2011 2010 2009 2011 2010 2011 2010
U.S. $29,739 $28,166 $26,737 6% 5% 6% 5%
Europe 17,243 15,049 14,573 15 398
APMEA 13,041 11,373 9,871 15 15 67
Other Countries & Corporate 7,625 6,559 5,747 16 14 12 15
Total $67,648 $61,147 $56,928 11% 7% 7% 7%
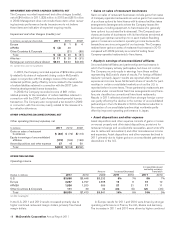
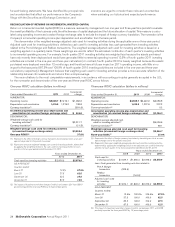
RESTAURANT MARGINS
• Franchised margins
Franchised margin dollars represent revenues from franchised
restaurants less the Company’s occupancy costs (rent and
depreciation) associated with those sites. Franchised margin
dollars represented about two-thirds of the combined restaurant
margins in 2011, 2010 and 2009. Franchised margin dollars
increased $768 million or 12% (9% in constant currencies) in
2011 and $479 million or 8% (8% in constant currencies) in
2010. Positive comparable sales were the primary driver of the
constant currency growth in franchised margin dollars in
both years.
Franchised margins
In millions 2011 2010 2009
U.S. $3,436 $3,239 $3,031
Europe 2,400 2,063 1,998
APMEA 858 686 559
Other Countries & Corporate 538 476 397
Total $7,232 $6,464 $5,985
Percent of revenues
U.S. 83.9% 83.4% 83.1%
Europe 79.1 78.2 78.3
APMEA 89.5 89.3 89.6
Other Countries & Corporate 86.1 86.0 86.1
Total 83.0% 82.4% 82.1%
In the U.S., the franchised margin percent increase in 2011
and 2010 was primarily due to positive comparable sales, partly
offset by higher occupancy costs.
In Europe, the franchised margin percent increase in 2011
was primarily due to positive comparable sales, partly offset by
McDonald’s Corporation Annual Report 2011 15