McDonalds 2011 Annual Report Download - page 22
Download and view the complete annual report
Please find page 22 of the 2011 McDonalds annual report below. You can navigate through the pages in the report by either clicking on the pages listed below, or by using the keyword search tool below to find specific information within the annual report.-
 1
1 -
2
-
3
-
4
-
5
-
6
-
7
-
8
-
9
-
10
-
11
-
 12
12 -
 13
13 -
 14
14 -
 15
15 -
 16
16 -
 17
17 -
 18
18 -
 19
19 -
 20
20 -
 21
21 -
 22
22 -
 23
23 -
 24
24 -
 25
25 -
 26
26 -
 27
27 -
 28
28 -
 29
29 -
 30
30 -
 31
31 -
 32
32 -
33
-
34
-
35
-
36
-
37
-
38
-
39
-
40
-
41
-
42
-
43
-
44
-
45
-
46
-
47
-
48
-
49
-
50
-
51
-
52
 |
 |

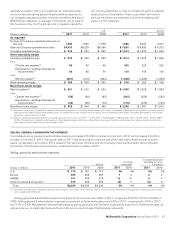
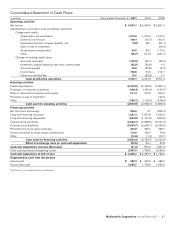
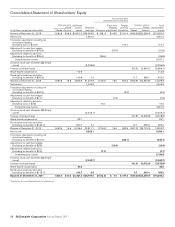
Cash used for investing activities totaled $2.6 billion in 2011,
an increase of $515 million compared with 2010. This reflects
higher capital expenditures, partly offset by higher proceeds from
sales of restaurant businesses. Cash used for investing activities
totaled $2.1 billion in 2010, an increase of $401 million com-
pared with 2009. This reflects higher capital expenditures and
lower proceeds from sales of investments and restaurant
businesses.
Cash used for financing activities totaled $4.5 billion in 2011,
an increase of $804 million compared with 2010, primarily due
to higher treasury stock purchases, an increase in the common
stock dividend, and lower proceeds from stock option exercises,
partly offset by higher net debt issuances. Cash used for financ-
ing activities totaled $3.7 billion in 2010, a decrease of $692
million compared with 2009, primarily due to higher net debt
issuances, higher proceeds from stock option exercises and
lower treasury stock purchases, partly offset by an increase in the
common stock dividend.
As a result of the above activity, the Company’s cash and
equivalents balance decreased $51 million in 2011 to $2.3 bil-
lion, compared with an increase of $591 million in 2010. In
addition to cash and equivalents on hand and cash provided by
operations, the Company can meet short-term funding needs
through its continued access to commercial paper borrowings
and line of credit agreements.
RESTAURANT DEVELOPMENT AND CAPITAL EXPENDITURES
In 2011, the Company opened 1,118 traditional restaurants and
32 satellite restaurants (small, limited-menu restaurants for which
the land and building are generally leased), and closed 246 tradi-
tional restaurants and 131 satellite restaurants. In 2010, the
Company opened 957 traditional restaurants and 35 satellite
restaurants, and closed 406 traditional restaurants and 327
satellite restaurants. Of these closures, there were over 400 in
McDonald’s Japan due to the strategic review of the market’s
restaurant portfolio. The majority of restaurant openings and clos-
ings occurred in the major markets in both years. The Company
closes restaurants for a variety of reasons, such as existing sales
and profit performance or loss of real estate tenure.
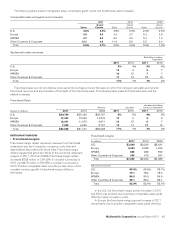
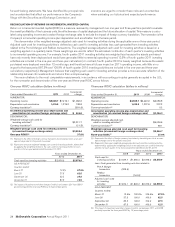
Systemwide restaurants at year end(1)
2011 2010 2009
U.S. 14,098 14,027 13,980
Europe 7,156 6,969 6,785
APMEA 8,865 8,424 8,488
Other Countries & Corporate 3,391 3,317 3,225
Total 33,510 32,737 32,478
(1) Includes satellite units at December 31, 2011, 2010 and 2009 as follows: U.S.—
1,084, 1,112, 1,155; Europe—240, 239, 241; APMEA (primarily Japan)—949,
1,010, 1,263; Other Countries & Corporate—459, 470, 464.
Approximately 65% of Company-operated restaurants and
over 75% of franchised restaurants were located in the major
markets at the end of 2011. Over 80% of the restaurants at
year-end 2011 were franchised.
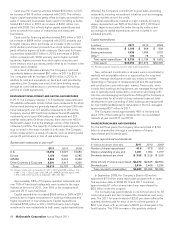
Capital expenditures increased $595 million or 28% in 2011
primarily due to higher reinvestment in existing restaurants and
higher investment in new restaurants. Capital expenditures
increased $183 million or 9% in 2010 primarily due to higher
investment in new restaurants. In both years, capital expenditures
reflected the Company’s commitment to grow sales at existing
restaurants, including reinvestment initiatives such as reimaging
in many markets around the world.
Capital expenditures invested in major markets, excluding
Japan, represented over 65% of the total in 2011, 2010 and
2009. Japan is accounted for under the equity method, and
accordingly its capital expenditures are not included in con-
solidated amounts.
Capital expenditures
In millions 2011 2010 2009
New restaurants $ 1,193 $ 968 $ 809
Existing restaurants 1,432 1,089 1,070
Other(1) 105 78 73
Total capital expenditures $ 2,730 $ 2,135 $ 1,952
Total assets $32,990 $31,975 $30,225
(1) Primarily corporate equipment and other office-related expenditures.
New restaurant investments in all years were concentrated in
markets with acceptable returns or opportunities for long-term
growth. Average development costs vary widely by market
depending on the types of restaurants built and the real estate
and construction costs within each market. These costs, which
include land, buildings and equipment, are managed through the
use of optimally sized restaurants, construction and design effi-
ciencies, and leveraging best practices. Although the Company is
not responsible for all costs for every restaurant opened, total
development costs (consisting of land, buildings and equipment)
for new traditional McDonald’s restaurants in the U.S. averaged
approximately $2.7 million in 2011.
The Company owned approximately 45% of the land and
about 70% of the buildings for restaurants in its consolidated
markets at year-end 2011 and 2010.
SHARE REPURCHASES AND DIVIDENDS
For the last three years, the Company returned a total of $16.1
billion to shareholders through a combination of shares
repurchased and dividends paid.
Shares repurchased and dividends
In millions, except per share data 2011 2010 2009
Number of shares repurchased 41.9 37.8 50.3
Shares outstanding at year end 1,021 1,054 1,077
Dividends declared per share $ 2.53 $ 2.26 $ 2.05
Dollar amount of shares repurchased $3,373 $2,648 $2,854
Dividends paid 2,610 2,408 2,235
Total returned to shareholders $5,983 $5,056 $5,089
In September 2009, the Company’s Board of Directors
approved a $10 billion share repurchase program with no speci-
fied expiration date. In 2009, 2010 and 2011 combined,
approximately 87 million shares have been repurchased for
$6.5 billion under this program.
The Company has paid dividends on its common stock for 36
consecutive years and has increased the dividend amount every
year. The 2011 full year dividend of $2.53 per share reflects the
quarterly dividend paid for each of the first three quarters of
$0.61 per share, with an increase to $0.70 per share paid in the
fourth quarter. This 15% increase in the quarterly dividend
20 McDonald’s Corporation Annual Report 2011