McDonalds 2011 Annual Report Download - page 26
Download and view the complete annual report
Please find page 26 of the 2011 McDonalds annual report below. You can navigate through the pages in the report by either clicking on the pages listed below, or by using the keyword search tool below to find specific information within the annual report.-
 1
1 -
2
-
3
-
4
-
5
-
6
-
7
-
8
-
9
-
10
-
11
-
12
-
13
-
14
-
15
-
 16
16 -
 17
17 -
 18
18 -
 19
19 -
 20
20 -
 21
21 -
 22
22 -
 23
23 -
 24
24 -
 25
25 -
 26
26 -
 27
27 -
 28
28 -
 29
29 -
 30
30 -
 31
31 -
 32
32 -
 33
33 -
 34
34 -
 35
35 -
 36
36 -
37
-
38
-
39
-
40
-
41
-
42
-
43
-
44
-
45
-
46
-
47
-
48
-
49
-
50
-
51
-
52
 |
 |

forward-looking statements. We have identified the principal risks
and uncertainties that affect our performance in the Company’s
filings with the Securities and Exchange Commission, and
investors are urged to consider these risks and uncertainties
when evaluating our historical and expected performance.
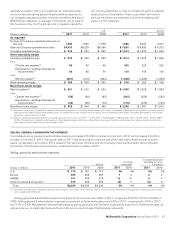
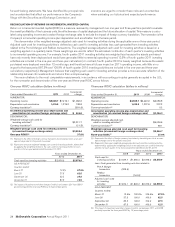
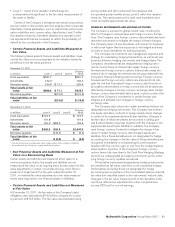
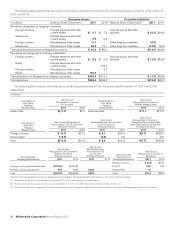
RECONCILIATION OF RETURNS ON INCREMENTAL INVESTED CAPITAL
Return on incremental invested capital (ROIIC) is a measure reviewed by management over one-year and three-year time periods to evaluate
the overall profitability of the business units, the effectiveness of capital deployed and the future allocation of capital. This measure is calcu-
lated using operating income and constant foreign exchange rates to exclude the impact of foreign currency translation. The numerator is the
Company’s incremental operating income plus depreciation and amortization from the base period.
The denominator is the weighted-average adjusted cash used for investing activities during the applicable one-or three-year period.
Adjusted cash used for investing activities is defined as cash used for investing activities less cash generated from investing activities
related to the Pret A Manger and Redbox transactions. The weighted-average adjusted cash used for investing activities is based on a
weighting applied on a quarterly basis. These weightings are used to reflect the estimated contribution of each quarter’s investing activities
to incremental operating income. For example, fourth quarter 2011 investing activities are weighted less because the assets purchased
have only recently been deployed and would have generated little incremental operating income (12.5% of fourth quarter 2011 investing
activities are included in the one-year and three-year calculations). In contrast, fourth quarter 2010 is heavily weighted because the assets
purchased were deployed more than 12 months ago, and therefore have a full year impact on 2011 operating income, with little or no
impact to the base period (87.5% and 100.0% of fourth quarter 2010 investing activities are included in the one-year and three-year
calculations, respectively). Management believes that weighting cash used for investing activities provides a more accurate reflection of the
relationship between its investments and returns than a simple average.
The reconciliations to the most comparable measurements, in accordance with accounting principles generally accepted in the U.S.,
for the numerator and denominator of the one-year and three-year ROIIC are as follows:
One-year ROIIC calculation (dollars in millions):
Years ended December 31, 2011 2010 Incremental
change
NUMERATOR:
Operating income $8,529.7 $7,473.1 $1,056.6
Depreciation and amortization 1,415.0 1,276.2 138.8
Currency translation(1) (331.4)
Incremental operating income plus depreciation and
amortization (at constant foreign exchange rates) $ 864.0
DENOMINATOR:
Weighted-average cash used for
investing activities(2) $2,311.7
Currency translation(1) (11.3)
Weighted-average cash used for investing activities
(at constant foreign exchange rates) $2,300.4
One-year ROIIC(3) 37.6%
(1) Represents the effect of foreign currency translation by translating results at an aver-
age exchange rate for the periods measured.
(2) Represents one-year weighted-average cash used for investing activities, determined
by applying the weightings below to the cash used for investing activities for each
quarter in the two-year period ended December 31, 2011.
Years ended December 31,
2010 2011
Cash used for investing activities $2,056.0 $2,570.9
AS A PERCENT
Quarters ended:
March 31 12.5% 87.5%
June 30 37.5 62.5
September 30 62.5 37.5
December 31 87.5 12.5
(3) The impact of impairment and other charges (credits), net between 2011 and 2010
positively impacted the one-year ROIIC by 3.4 percentage points.
Three-year ROIIC calculation (dollars in millions):
Years ended December 31, 2011 2008 Incremental
change
NUMERATOR:
Operating income $8,529.7 $6,442.9 $2,086.8
Depreciation and amortization 1,415.0 1,207.8 207.2
Currency translation(4) 0.2
Incremental operating income plus depreciation and
amortization (at constant foreign exchange rates) $2,294.2
DENOMINATOR:
Weighted-average adjusted cash
used for investing activities(5) $6,026.6
Currency translation(4) 38.1
Weighted-average adjusted cash used for investing
activities (at constant foreign exchange rates) $6,064.7
Three-year ROIIC(6) 37.8%
(4) Represents the effect of foreign currency translation by translating results at an aver-
age exchange rate for the periods measured.
(5) Represents three-year weighted-average adjusted cash used for investing activities,
determined by applying the weightings below to the adjusted cash used for investing
activities for each quarter in the four-year period ended December 31, 2011.
Years ended December 31,
2008 2009 2010 2011
Cash used for
investing activities $1,624.7 $1,655.3 $2,056.0 $2,570.9
Less: Cash generated from investing activities related to
Pret A Manger
transaction (229.4)
Redbox
transaction (144.9)
Adjusted cash used
for investing
activities $1,854.1 $1,800.2 $2,056.0 $2,570.9
AS A PERCENT
Quarters ended:
March 31 12.5% 100.0% 100.0% 87.5%
June 30 37.5 100.0 100.0 62.5
September 30 62.5 100.0 100.0 37.5
December 31 87.5 100.0 100.0 12.5
(6) The impact of impairment and other charges (credits), net between 2011 and 2008
positively impacted the three year ROIIC by 1.2 percentage points.
24 McDonald’s Corporation Annual Report 2011