McDonalds 2011 Annual Report Download - page 16
Download and view the complete annual report
Please find page 16 of the 2011 McDonalds annual report below. You can navigate through the pages in the report by either clicking on the pages listed below, or by using the keyword search tool below to find specific information within the annual report.-
 1
1 -
2
-
3
-
4
-
5
-
 6
6 -
 7
7 -
 8
8 -
 9
9 -
 10
10 -
 11
11 -
 12
12 -
 13
13 -
 14
14 -
 15
15 -
 16
16 -
 17
17 -
 18
18 -
 19
19 -
 20
20 -
 21
21 -
 22
22 -
 23
23 -
 24
24 -
 25
25 -
 26
26 -
27
-
28
-
29
-
30
-
31
-
32
-
33
-
34
-
35
-
36
-
37
-
38
-
39
-
40
-
41
-
42
-
43
-
44
-
45
-
46
-
47
-
48
-
49
-
50
-
51
-
52
 |
 |

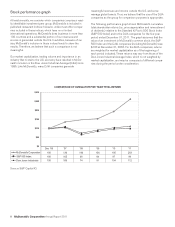
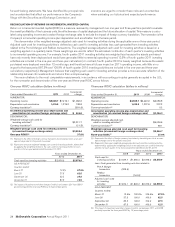
NET INCOME AND DILUTED EARNINGS PER COMMON SHARE
In 2011, net income and diluted earnings per common share
were $5.5 billion and $5.27. Foreign currency translation had a
positive impact of $0.19 on diluted earnings per share.
In 2010, net income and diluted earnings per common share
were $4.9 billion and $4.58. Results included after tax charges
due to Impairment and other charges (credits), net of $25 million
or $0.02 per share, primarily related to the Company’s share of
restaurant closing costs in McDonald’s Japan (a 50%-owned
affiliate) in conjunction with the strategic review of the market’s
restaurant portfolio, partly offset by income related to the reso-
lution of certain liabilities retained in connection with the 2007
Latin America developmental license transaction. Foreign cur-
rency translation had a positive impact of $0.01 per share on
diluted earnings per share.
In 2009, net income and diluted earnings per common share
were $4.6 billion and $4.11. Results benefited by after tax
income due to Impairment and other charges (credits), net of
$91 million or $0.08 per share, primarily due to the resolution of
certain liabilities retained in connection with the 2007 Latin
America developmental license transaction. Results also bene-
fited by an after tax gain of $59 million or $0.05 per share due to
the sale of the Company’s minority ownership interest in Redbox,
reflected in Gain on sale of investment. Results were negatively
impacted by $0.15 per share due to the effect of foreign cur-
rency translation.
The Company repurchased 41.9 million shares of its stock for
$3.4 billion in 2011 and 37.8 million shares of its stock for nearly
$2.7 billion in 2010, driving reductions of over 3% and 2% of total
shares outstanding, respectively, net of stock option exercises.
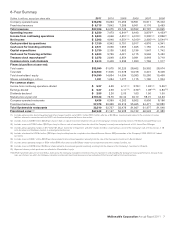
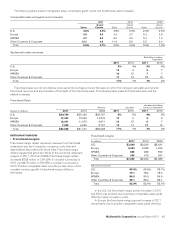
REVENUES
The Company’s revenues consist of sales by Company-operated restaurants and fees from restaurants operated by franchisees. Rev-
enues from conventional franchised restaurants include rent and royalties based on a percent of sales along with minimum rent
payments, and initial fees. Revenues from franchised restaurants that are licensed to foreign affiliates and developmental licensees
include a royalty based on a percent of sales, and generally include initial fees.
In 2011 and 2010, constant currency revenue growth was driven primarily by positive comparable sales as well as expansion.
Revenues
Amount Increase/(decrease)
Increase/(decrease)
excluding currency
translation
Dollars in millions 2011 2010 2009 2011 2010 2011 2010
Company-operated sales:
U.S. $ 4,433 $ 4,229 $ 4,295 5% (2)% 5% (2)%
Europe 7,852 6,932 6,721 13 385
APMEA 5,061 4,297 3,714 18 16 11 9
Other Countries & Corporate 947 775 729 22 617 (3)
Total $18,293 $16,233 $15,459 13% 5% 8% 4%
Franchised revenues:
U.S. $ 4,096 $ 3,883 $ 3,649 5% 6% 5% 6%
Europe 3,034 2,637 2,553 15 398
APMEA 958 769 623 25 23 14 11
Other Countries & Corporate 625 553 461 13 20 816
Total $ 8,713 $ 7,842 $ 7,286 11% 8% 8% 8%
Total revenues:
U.S. $ 8,529 $ 8,112 $ 7,944 5% 2% 5% 2%
Europe 10,886 9,569 9,274 14 386
APMEA 6,019 5,066 4,337 19 17 11 9
Other Countries & Corporate 1,572 1,328 1,190 18 12 14 4
Total $27,006 $24,075 $22,745 12% 6% 8% 5%
In the U.S., revenues in 2011 and 2010 were positively
impacted by the ongoing appeal of our iconic core products and
the success of new products, as well as continued focus on
everyday value, convenience and modernizing the customer
experience. New products introduced in 2011 included Fruit &
Maple Oatmeal and additions to the McCafé beverage line, while
new products introduced in 2010 included McCafé frappés and
smoothies as well as the Angus Snack Wraps. Refranchising
activity negatively impacted revenue growth in 2010.
Europe’s constant currency increase in revenues in 2011 was
primarily driven by comparable sales increases in Russia (which is
entirely Company-operated), the U.K., France and Germany, as
well as expansion in Russia. The 2010 increase was primarily
driven by comparable sales increases in the U.K., France and
Russia, as well as expansion in Russia, partly offset by the impact
of refranchising activity primarily in the U.K.
In APMEA, the constant currency increase in revenues in
2011 was primarily driven by comparable sales increases in
China and most other markets. The 2010 increase was primarily
driven by comparable sales increases in China, Australia and
most other markets. In addition, expansion in China contributed to
the increases in both years.
14 McDonald’s Corporation Annual Report 2011