McDonalds 2011 Annual Report Download - page 42
Download and view the complete annual report
Please find page 42 of the 2011 McDonalds annual report below. You can navigate through the pages in the report by either clicking on the pages listed below, or by using the keyword search tool below to find specific information within the annual report.-
 1
1 -
2
-
3
-
4
-
5
-
6
-
7
-
8
-
9
-
10
-
11
-
12
-
13
-
14
-
15
-
16
-
17
-
18
-
19
-
20
-
21
-
22
-
23
-
24
-
25
-
26
-
27
-
28
-
29
-
30
-
31
-
 32
32 -
 33
33 -
 34
34 -
 35
35 -
 36
36 -
 37
37 -
 38
38 -
 39
39 -
 40
40 -
 41
41 -
 42
42 -
 43
43 -
 44
44 -
 45
45 -
 46
46 -
 47
47 -
 48
48 -
 49
49 -
 50
50 -
 51
51 -
 52
52
 |
 |

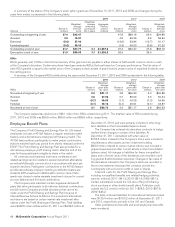
A summary of the status of the Company’s stock option grants as of December 31, 2011, 2010 and 2009, and changes during the
years then ended, is presented in the following table:
2011 2010 2009
Options Shares in
millions
Weighted-
average
exercise
price
Weighted-
average
remaining
contractual
life in years
Aggregate
intrinsic
value in
millions Shares in
millions
Weighted-
average
exercise
price Shares in
millions
Weighted-
average
exercise
price
Outstanding at beginning of year 37.4 $42.47 47.8 $38.16 53.4 $34.88
Granted 3.9 75.97 4.5 63.26 5.6 56.94
Exercised (9.0) 37.46 (13.6) 33.84 (10.7) 31.17
Forfeited/expired (0.6) 55.00 (1.3) 46.03 (0.5) 47.22
Outstanding at end of year 31.7 $47.77 5.1 $1,667.6 37.4 $42.47 47.8 $38.16
Exercisable at end of year 21.9 $39.53 3.7 $1,328.8 26.4 35.4
RSUs
RSUs generally vest 100% on the third anniversary of the grant and are payable in either shares of McDonald’s common stock or cash,
at the Company’s discretion. Certain executives have been awarded RSUs that vest based on Company performance. The fair value of
each RSU granted is equal to the market price of the Company’s stock at date of grant less the present value of expected dividends over
the vesting period.
A summary of the Company’s RSU activity during the years ended December 31, 2011, 2010 and 2009 is presented in the following table:
2011 2010 2009
RSUs Shares in
millions
Weighted-
average
grant date
fair value Shares in
millions
Weighted-
average
grant date
fair value Shares in
millions
Weighted-
average
grant date
fair value
Nonvested at beginning of year 2.3 $51.17 2.8 $46.33 3.0 $40.88
Granted 0.6 67.96 0.7 56.09 0.9 50.34
Vested (0.7) 49.88 (1.1) 42.08 (1.0) 34.56
Forfeited (0.1) 50.16 (0.1) 49.61 (0.1) 43.87
Nonvested at end of year 2.1 $56.78 2.3 $51.17 2.8 $46.33
The Company realized tax deductions of $6.1 million from RSUs vested during 2011. The total fair value of RSUs vested during
2011, 2010 and 2009 was $55.5 million, $66.8 million and $59.9 million, respectively.
Employee Benefit Plans
The Company’s Profit Sharing and Savings Plan for U.S.-based
employees includes a 401(k) feature, a regular employee match
feature, and a discretionary employer profit sharing match. The
401(k) feature allows participants to make pretax contributions
that are matched each pay period from shares released under the
ESOP. The Profit Sharing and Savings Plan also provides for a
discretionary employer profit sharing match after the end of the
year for those participants eligible to share in the match.
All current account balances and future contributions and
related earnings can be invested in several investment alternatives
as well as McDonald’s common stock in accordance with each par-
ticipant’s elections. Participants’ contributions to the 401(k) feature
and the discretionary employer matching contribution feature are
limited to 20% investment in McDonald’s common stock. Partic-
ipants may choose to make separate investment choices for current
account balances and for future contributions.
The Company also maintains certain supplemental benefit
plans that allow participants to (i) make tax-deferred contributions
and (ii) receive Company-provided allocations that cannot be
made under the Profit Sharing and Savings Plan because of
Internal Revenue Service limitations. The investment alternatives
and returns are based on certain market-rate investment alter-
natives under the Profit Sharing and Savings Plan. Total liabilities
were $482.5 million at December 31, 2011, and $439.3 million at
December 31, 2010, and were primarily included in other long-
term liabilities on the Consolidated balance sheet.
The Company has entered into derivative contracts to hedge
market-driven changes in certain of the liabilities. At
December 31, 2011, derivatives with a fair value of
$154.5 million indexed to the Company’s stock were included in
miscellaneous other assets and an investment totaling
$98.3 million indexed to certain market indices was included in
prepaid expenses and other current assets on the Consolidated
balance sheet. All changes in liabilities for these nonqualified
plans and in the fair value of the derivatives are recorded in sell-
ing, general & administrative expenses. Changes in fair value of
the derivatives indexed to the Company’s stock are recorded in
the income statement because the contracts provide the
counterparty with a choice to settle in cash or shares.
Total U.S. costs for the Profit Sharing and Savings Plan,
including nonqualified benefits and related hedging activities,
were (in millions): 2011–$41.3; 2010–$51.4; 2009–$51.3.
Certain subsidiaries outside the U.S. also offer profit sharing,
stock purchase or other similar benefit plans. Total plan costs
outside the U.S. were (in millions): 2011–$58.3; 2010–$57.6;
2009–$45.2.
The total combined liabilities for international retirement plans
were $125.4 million and $153.2 million at December 31, 2011
and 2010, respectively, primarily in the U.K. and Canada.
Other postretirement benefits and post-employment benefits
were immaterial.
40 McDonald’s Corporation Annual Report 2011