McDonalds 2011 Annual Report Download - page 23
Download and view the complete annual report
Please find page 23 of the 2011 McDonalds annual report below. You can navigate through the pages in the report by either clicking on the pages listed below, or by using the keyword search tool below to find specific information within the annual report.-
 1
1 -
2
-
3
-
4
-
5
-
6
-
7
-
8
-
9
-
10
-
11
-
12
-
 13
13 -
 14
14 -
 15
15 -
 16
16 -
 17
17 -
 18
18 -
 19
19 -
 20
20 -
 21
21 -
 22
22 -
 23
23 -
 24
24 -
 25
25 -
 26
26 -
 27
27 -
 28
28 -
 29
29 -
 30
30 -
 31
31 -
 32
32 -
 33
33 -
34
-
35
-
36
-
37
-
38
-
39
-
40
-
41
-
42
-
43
-
44
-
45
-
46
-
47
-
48
-
49
-
50
-
51
-
52
 |
 |

equates to a $2.80 per share annual dividend and reflects the
Company’s confidence in the ongoing strength and reliability of
its cash flow. As in the past, future dividend amounts will be con-
sidered after reviewing profitability expectations and financing
needs, and will be declared at the discretion of the Company’s
Board of Directors.
Financial Position and Capital Resources
TOTAL ASSETS AND RETURNS
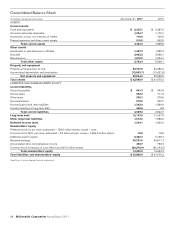
Total assets increased $1.0 billion or 3% in 2011. Excluding the
effect of changes in foreign currency exchange rates, total
assets increased $1.4 billion in 2011. Over 75% of total assets
were in major markets at year-end 2011. Net property and
equipment increased $774 million in 2011 and represented
about 70% of total assets at year end. Excluding the effect of
changes in foreign currency exchange rates, net property and
equipment increased $1.1 billion primarily due to capital
expenditures, partly offset by depreciation.
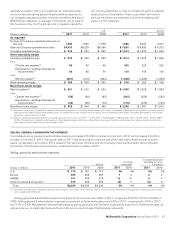
Operating income is used to compute return on average
assets, while net income is used to calculate return on average
common equity. Month-end balances are used to compute both
average assets and average common equity.
2011 2010 2009
Return on average assets 26.0% 24.7% 23.4%
Return on average common
equity 37.7 35.3 34.0
In 2011, 2010, and 2009, return on average assets and
return on average common equity benefited from strong global
operating results. Operating income, as reported, does not
include interest income; however, cash balances are included in
average assets. The inclusion of cash balances in average assets
reduced return on average assets by about two percentage
points for all years presented.
FINANCING AND MARKET RISK
The Company generally borrows on a long-term basis and is
exposed to the impact of interest rate changes and foreign cur-
rency fluctuations. Debt obligations at December 31, 2011
totaled $12.5 billion, compared with $11.5 billion at
December 31, 2010. The net increase in 2011 was primarily due
to net issuances of $1.0 billion.
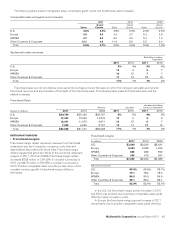
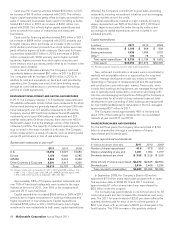
Debt highlights(1)
2011 2010 2009
Fixed-rate debt as a percent of total
debt(2,3) 69% 66% 68%
Weighted-average annual interest rate
of total debt(3) 4.2 4.3 4.5
Foreign currency-denominated debt as a
percent of total debt(2) 40 41 43
Total debt as a percent of total
capitalization (total debt and total
shareholders’ equity)(2) 46 44 43
Cash provided by operations as a
percent of total debt(2) 57 55 55
(1) All percentages are as of December 31, except for the weighted-average annual
interest rate, which is for the year.
(2) Based on debt obligations before the effect of fair value hedging adjustments. This
effect is excluded as these adjustments have no impact on the obligation at maturity.
See Debt financing note to the consolidated financial statements.
(3) Includes the effect of interest rate swaps.
Fitch, Standard & Poor’s and Moody’s currently rate, with a
stable outlook, the Company’s commercial paper F1, A-1 and
P-1, respectively; and its long-term debt A, A and A2,
respectively.
Certain of the Company’s debt obligations contain cross-
acceleration provisions and restrictions on Company and
subsidiary mortgages and the long-term debt of certain sub-
sidiaries. There are no provisions in the Company’s debt
obligations that would accelerate repayment of debt as a result of
a change in credit ratings or a material adverse change in the
Company’s business. Under existing authorization from the
Company’s Board of Directors, at December 31, 2011, the
Company had $1.7 billion of authority remaining to borrow funds,
including through (i) public or private offering of debt securities;
(ii) direct borrowing from banks or other financial institutions; and
(iii) other forms of indebtedness. In addition to debt securities
available through a medium-term notes program registered with
the U.S. Securities and Exchange Commission (SEC) and a
Global Medium-Term Notes program, the Company has $1.5 bil-
lion available under committed line of credit agreements as well
as authority to issue commercial paper in the U.S. and global
markets (see Debt financing note to the consolidated financial
statements). Debt maturing in 2012 is approximately $964 mil-
lion of long-term corporate debt. In 2012, the Company expects
to issue commercial paper and long-term debt to refinance this
maturing debt. Consequently, in February 2012, the Company
issued $250.0 million of 10-year U.S. Dollar-denominated notes
at a coupon rate of 2.625%, and $500.0 million of 30-year U.S.
Dollar-denominated notes at a coupon rate of 3.70%. The
Company also has $640 million of foreign currency bank line
borrowings outstanding at year-end 2011.
The Company uses major capital markets, bank financings
and derivatives to meet its financing requirements and reduce
interest expense. The Company manages its debt portfolio in
response to changes in interest rates and foreign currency rates
by periodically retiring, redeeming and repurchasing debt, termi-
nating swaps and using derivatives. The Company does not use
derivatives with a level of complexity or with a risk higher than the
exposures to be hedged and does not hold or issue derivatives
for trading purposes. All swaps are over-the-counter instruments.
In managing the impact of interest rate changes and foreign
currency fluctuations, the Company uses interest rate swaps and
finances in the currencies in which assets are denominated. The
Company uses foreign currency debt and derivatives to hedge
the foreign currency risk associated with certain royalties, inter-
company financings and long-term investments in foreign
subsidiaries and affiliates. This reduces the impact of fluctuating
foreign currencies on cash flows and shareholders’ equity. Total
foreign currency-denominated debt was $5.0 billion and
$4.7 billion for the years ended December 31, 2011 and 2010,
respectively. In addition, where practical, the Company’s restau-
rants purchase goods and services in local currencies resulting in
natural hedges. See Summary of significant accounting policies
note to the consolidated financial statements related to financial
instruments and hedging activities for additional information
regarding the accounting impact and use of derivatives.
The Company does not have significant exposure to any
individual counterparty and has master agreements that contain
netting arrangements. Certain of these agreements also require
each party to post collateral if credit ratings fall below, or
aggregate exposures exceed, certain contractual limits. At
McDonald’s Corporation Annual Report 2011 21