McDonalds 2011 Annual Report Download - page 19
Download and view the complete annual report
Please find page 19 of the 2011 McDonalds annual report below. You can navigate through the pages in the report by either clicking on the pages listed below, or by using the keyword search tool below to find specific information within the annual report.-
 1
1 -
2
-
3
-
4
-
5
-
6
-
7
-
8
-
 9
9 -
 10
10 -
 11
11 -
 12
12 -
 13
13 -
 14
14 -
 15
15 -
 16
16 -
 17
17 -
 18
18 -
 19
19 -
 20
20 -
 21
21 -
 22
22 -
 23
23 -
 24
24 -
 25
25 -
 26
26 -
 27
27 -
 28
28 -
 29
29 -
30
-
31
-
32
-
33
-
34
-
35
-
36
-
37
-
38
-
39
-
40
-
41
-
42
-
43
-
44
-
45
-
46
-
47
-
48
-
49
-
50
-
51
-
52
 |
 |

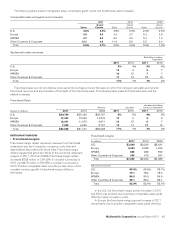
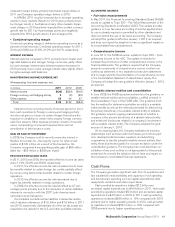
generally accepted in the U.S. In particular, as noted previously,
we do not allocate selling, general & administrative expenses to
our Company-operated business. However, we believe that about
$50,000 per restaurant, on average, is the typical cost to support
this business in the U.S. The actual costs in markets outside the
U.S. will vary depending on local circumstances and the organiza-
tional structure of the market. These costs reflect the indirect
services we believe are necessary to provide the appropriate
support of the restaurant.
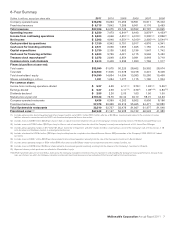
U.S. Europe
Dollars in millions 2011 2010 2009 2011 2010 2009
As reported
Number of Company-operated restaurants at
year end 1,552 1,550 1,578 1,985 2,005 2,001
Sales by Company-operated restaurants $4,433 $4,229 $4,295 $ 7,852 $ 6,932 $ 6,721
Company-operated margin $ 914 $ 902 $ 832 $ 1,514 $ 1,373 $ 1,240
Store operating margin
Company-operated margin $ 914 $ 902 $ 832 $ 1,514 $ 1,373 $ 1,240
Plus:
Outside rent expense(1) 56 60 65 242 223 222
Depreciation—buildings & leasehold
improvements(1) 69 65 70 118 105 100
Less:
Rent & royalties(2) (651) (619) (634) (1,598) (1,409) (1,363)
Store operating margin $ 388 $ 408 $ 333 $ 276 $ 292 $ 199
Brand/real estate margin
Rent & royalties(2) $ 651 $ 619 $ 634 $ 1,598 $ 1,409 $ 1,363
Less:
Outside rent expense(1) (56) (60) (65) (242) (223) (222)
Depreciation—buildings & leasehold
improvements(1) (69) (65) (70) (118) (105) (100)
Brand/real estate margin $ 526 $ 494 $ 499 $ 1,238 $ 1,081 $ 1,041
(1) Represents certain costs recorded as occupancy & other operating expenses in the Consolidated statement of income – rent payable by McDonald’s to third parties on leased sites and
depreciation for buildings and leasehold improvements. This adjustment is made to reflect these occupancy costs in Brand/real estate margin. The relative percentage of sites that are
owned versus leased varies by country.
(2) Reflects average Company-operated rent and royalties (as a percent of sales: U.S.: 2011 – 14.7%; 2010 – 14.6%; 2009 – 14.8%; Europe: 2011 – 20.4%; 2010 – 20.3%; 2009 –
20.3%). This adjustment is made to reflect expense in Store operating margin and income in Brand/real estate margin. Countries within Europe have varying economic profiles and a
wide range of rent and royalty rates as a percentage of sales.
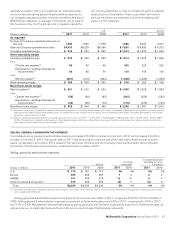
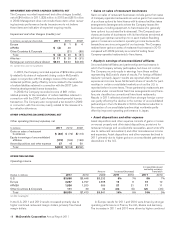
SELLING, GENERAL & ADMINISTRATIVE EXPENSES
Consolidated selling, general & administrative expenses increased 3% (flat in constant currencies) in 2011 and increased 4% (4% in
constant currencies) in 2010. The growth rate for 2011 was flat as higher employee and other costs were offset by lower incentive
based compensation and costs in 2010 related to the Vancouver Olympics and the Company’s biennial Worldwide Owner/Operator
Convention. The Olympics and Convention contributed to the increase in 2010.
Selling, general & administrative expenses
Amount Increase/
(decrease)
Increase/(decrease)
excluding currency
translation
Dollars in millions 2011 2010 2009 2011 2010 2011 2010
U.S. $ 779 $ 781 $ 751 0% 4% 0% 4%
Europe 699 653 655 7022
APMEA 341 306 276 12 10 54
Other Countries & Corporate(1) 575 593 552 (3) 7(4) 5
Total $2,394 $2,333 $2,234 3% 4% 0% 4%
(1) Included in Other Countries & Corporate are home office support costs in areas such as facilities, finance, human resources, information technology, legal, marketing, restaurant oper-
ations, supply chain and training.
Selling, general & administrative expenses as a percent of revenues were 8.9% in 2011 compared with 9.7% in 2010 and 9.8% in
2009. Selling, general & administrative expenses as a percent of Systemwide sales were 2.8% in 2011 compared with 3.0% in 2010
and 3.1% in 2009. Management believes that analyzing selling, general & administrative expenses as a percent of Systemwide sales, as
well as revenues, is meaningful because these costs are incurred to support Systemwide restaurants.
McDonald’s Corporation Annual Report 2011 17