McDonalds 2011 Annual Report Download - page 21
Download and view the complete annual report
Please find page 21 of the 2011 McDonalds annual report below. You can navigate through the pages in the report by either clicking on the pages listed below, or by using the keyword search tool below to find specific information within the annual report.-
 1
1 -
2
-
3
-
4
-
5
-
6
-
7
-
8
-
9
-
10
-
 11
11 -
 12
12 -
 13
13 -
 14
14 -
 15
15 -
 16
16 -
 17
17 -
 18
18 -
 19
19 -
 20
20 -
 21
21 -
 22
22 -
 23
23 -
 24
24 -
 25
25 -
 26
26 -
 27
27 -
 28
28 -
 29
29 -
 30
30 -
 31
31 -
32
-
33
-
34
-
35
-
36
-
37
-
38
-
39
-
40
-
41
-
42
-
43
-
44
-
45
-
46
-
47
-
48
-
49
-
50
-
51
-
52
 |
 |

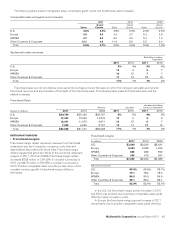
restaurant margin dollars, primarily franchised margin dollars in
2011 and Company-operated margin dollars in 2010.
In APMEA, 2011 results increased due to stronger operating
results in many markets. Results for 2010 were primarily driven
by stronger results in Australia and many other markets. Impair-
ment charges in 2010 positively impacted the constant currency
growth rate for 2011 by 4 percentage points and negatively
impacted the 2010 growth rate by 4 percentage points.
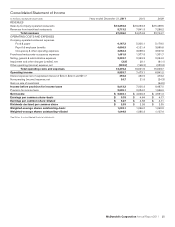
• Combined operating margin
Combined operating margin is defined as operating income as a
percent of total revenues. Combined operating margin for 2011,
2010 and 2009 was 31.6%, 31.0% and 30.1%, respectively.
INTEREST EXPENSE
Interest expense increased in 2011 primarily due to higher aver-
age debt balances and stronger foreign currencies, partly offset
by lower average interest rates. Interest expense decreased in
2010 primarily due to lower average interest rates slightly offset
by higher average debt balances.
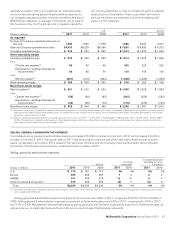
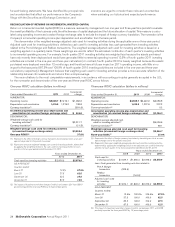
NONOPERATING (INCOME) EXPENSE, NET
Nonoperating (income) expense, net
In millions 2011 2010 2009
Interest income $(39) $(20) $(19)
Foreign currency and hedging activity 9(2) (32)
Other expense 55 44 27
Total $25 $ 22 $(24)
Interest income consists primarily of interest earned on short-
term cash investments. Foreign currency and hedging activity
includes net gains or losses on certain hedges that reduce the
exposure to variability on certain intercompany foreign currency
cash flow streams. Other expense primarily consists of miscella-
neous nonoperating income and expense items such as
amortization of debt issuance costs.
GAIN ON SALE OF INVESTMENT
In 2009, the Company sold its minority ownership interest in
Redbox to Coinstar, Inc., the majority owner, for total consid-
eration of $145 million. As a result of the transaction, the
Company recognized a nonoperating pretax gain of $95 million
(after tax – $59 million or $0.05 per share).
PROVISION FOR INCOME TAXES
In 2011, 2010 and 2009, the reported effective income tax rates
were 31.3%, 29.3% and 29.8%, respectively.
In 2011, the effective income tax rate increased due to lower
tax benefits related to certain foreign tax credits, partially offset
by nonrecurring deferred tax benefits related to certain foreign
operations.
In 2010, the effective income tax rate decreased due to
higher tax benefits related to foreign operations.
In 2009, the effective income tax rate benefited by 0.7 per-
centage points primarily due to the resolution of certain liabilities
retained in connection with the 2007 Latin America devel-
opmental license transaction.
Consolidated net deferred tax liabilities included tax assets,
net of valuation allowance, of $1.5 billion and $1.6 billion in 2011
and 2010, respectively. Substantially all of the net tax assets are
expected to be realized in the U.S. and other profitable markets.
ACCOUNTING CHANGES
• Fair value measurements
In May 2011, the Financial Accounting Standards Board (FASB)
issued an update to Topic 820 – Fair Value Measurement of the
Accounting Standards Codification (ASC). This update provides
guidance on how fair value accounting should be applied where
its use is already required or permitted by other standards and
does not extend the use of fair value accounting. The Company
will adopt this guidance effective January 1, 2012, as required,
and does not expect the adoption to have a significant impact on
its consolidated financial statements.
• Comprehensive Income
In June 2011, the FASB issued an update to Topic 220 – Com-
prehensive Income of the ASC. The update is intended to
increase the prominence of other comprehensive income in the
financial statements. The guidance requires that the Company
presents components of comprehensive income in either one
continuous statement or two separate consecutive statements
and no longer permits the presentation of comprehensive income
in the Consolidated statement of shareholders’ equity. The
Company will adopt this new guidance effective January 1, 2012,
as required.
• Variable interest entities and consolidation
In June 2009, the FASB issued amendments to the guidance on
variable interest entities and consolidation, codified primarily in
the Consolidation Topic of the FASB ASC. This guidance modi-
fies the method for determining whether an entity is a variable
interest entity as well as the methods permitted for determining
the primary beneficiary of a variable interest entity. In addition,
this guidance requires ongoing reassessments of whether a
company is the primary beneficiary of a variable interest entity
and enhanced disclosures related to a company’s involvement
with a variable interest entity. The Company adopted this guid-
ance as of January 1, 2010.
On an ongoing basis, the Company evaluates its business
relationships such as those with franchisees, joint venture part-
ners, developmental licensees, suppliers, and advertising
cooperatives to identify potential variable interest entities. Gen-
erally, these businesses qualify for a scope exception under the
consolidation guidance. The Company has concluded that con-
solidation of any such entities is not appropriate for the periods
presented. As a result, the adoption did not have any impact on
the Company’s consolidated financial statements.
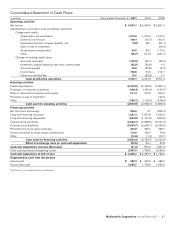
Cash Flows
The Company generates significant cash from its operations and
has substantial credit availability and capacity to fund operating
and discretionary spending such as capital expenditures, debt
repayments, dividends and share repurchases.
Cash provided by operations totaled $7.2 billion and
exceeded capital expenditures by $4.4 billion in 2011, while cash
provided by operations totaled $6.3 billion and exceeded capital
expenditures by $4.2 billion in 2010. In 2011, cash provided by
operations increased $808 million or 13% compared with 2010
primarily due to higher operating results. In 2010, cash provided
by operations increased $591 million or 10% compared with
2009 primarily due to higher operating results.
McDonald’s Corporation Annual Report 2011 19