McDonalds 2011 Annual Report Download - page 41
Download and view the complete annual report
Please find page 41 of the 2011 McDonalds annual report below. You can navigate through the pages in the report by either clicking on the pages listed below, or by using the keyword search tool below to find specific information within the annual report.-
 1
1 -
2
-
3
-
4
-
5
-
6
-
7
-
8
-
9
-
10
-
11
-
12
-
13
-
14
-
15
-
16
-
17
-
18
-
19
-
20
-
21
-
22
-
23
-
24
-
25
-
26
-
27
-
28
-
29
-
30
-
 31
31 -
 32
32 -
 33
33 -
 34
34 -
 35
35 -
 36
36 -
 37
37 -
 38
38 -
 39
39 -
 40
40 -
 41
41 -
 42
42 -
 43
43 -
 44
44 -
 45
45 -
 46
46 -
 47
47 -
 48
48 -
 49
49 -
 50
50 -
 51
51 -
52
 |
 |

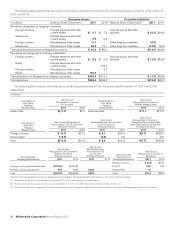
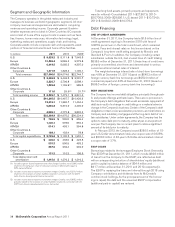
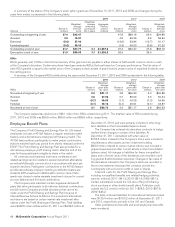
The following table summarizes the Company’s debt obligations. (Interest rates and debt amounts reflected in the table include the
effects of interest rate swaps.)
Interest rates(1)
December 31 Amounts outstanding
December 31
In millions of U.S. Dollars Maturity dates 2011 2010 2011 2010
Fixed 5.1% 5.4% $ 6,039.3 $ 5,318.0
Floating 2.0 3.0 1,399.9 1,390.0
Total U.S. Dollars 2012-2040 7,439.2 6,708.0
Fixed 4.5 4.8 1,167.0 737.5
Floating 2.8 2.2 719.0 753.4
Total Euro 2012-2021 1,886.0 1,490.9
Fixed 2.9 2.1 162.4 338.7
Floating 0.6 0.5 1,039.4 985.4
Total Japanese Yen 2013-2030 1,201.8 1,324.1
Total British Pounds Sterling-Fixed 2020-2032 6.0 6.0 697.8 700.7
Fixed 2.8 2.5 495.8 451.6
Floating 5.6 4.1 723.9 752.6
Total other currencies(2) 2012-2021 1,219.7 1,204.2
Debt obligations before fair value adjustments(3) 12,444.5 11,427.9
Fair value adjustments(4) 55.9 77.4
Total debt obligations(5) $12,500.4 $11,505.3
(1) Weighted-average effective rate, computed on a semi-annual basis.
(2) Primarily consists of Swiss Francs, Chinese Renminbi and Korean Won.
(3) Aggregate maturities for 2011 debt balances, before fair value adjustments, were as follows (in millions): 2012–$366.6; 2013–$1,026.0; 2014–$737.9; 2015–$656.3;
2016–$2,158.6; Thereafter–$7,499.1. These amounts include a reclassification of short-term obligations totaling $1.5 billion to long-term obligations as they are supported by a long-
term line of credit agreement expiring in November 2016.
(4) The carrying value of underlying items in fair value hedges, in this case debt obligations, are adjusted for fair value changes to the extent they are attributable to the risk designated as
being hedged. The related hedging instrument is also recorded at fair value in prepaid expenses and other current assets, miscellaneous other assets or other long-term liabilities. A por-
tion ($0.5 million) of the adjustments at December 31, 2011 related to interest rate swaps that were terminated in December 2002 and will amortize as a reduction of interest expense
over the remaining life of the debt.
(5) Includes notes payable, current maturities of long-term debt and long-term debt included on the Consolidated balance sheet. The increase in debt obligations from December 31, 2010
to December 31, 2011 was primarily due to net issuances of $1.0 billion.
Share-based Compensation
The Company maintains a share-based compensation plan which
authorizes the granting of various equity-based incentives includ-
ing stock options and restricted stock units (RSUs) to employees
and nonemployee directors. The number of shares of common
stock reserved for issuance under the plans was 61.4 million at
December 31, 2011, including 27.6 million available for
future grants.
STOCK OPTIONS
Stock options to purchase common stock are granted with an
exercise price equal to the closing market price of the Company’s
stock on the date of grant. Substantially all of the options
become exercisable in four equal installments, beginning a year
from the date of the grant, and generally expire 10 years from the
grant date. Options granted between May 1, 1999 and
December 31, 2000 (approximately 3.5 million options out-
standing at December 31, 2011) expire 13 years from the date
of grant.
Intrinsic value for stock options is defined as the difference
between the current market value of the Company’s stock and
the exercise price. During 2011, 2010 and 2009, the total
intrinsic value of stock options exercised was $416.5 million,
$500.8 million and $302.5 million, respectively. Cash received
from stock options exercised during 2011 was $334.0 million
and the actual tax benefit realized for tax deductions from stock
options exercised totaled $110.6 million. The Company uses
treasury shares purchased under the Company’s share
repurchase program to satisfy share-based exercises.
McDonald’s Corporation Annual Report 2011 39